

Deploying an AI agent is the easy part. Keeping it reliable in production, understanding why it chose a tool or response, and proving it behaved safely is the real challenge. Traditional monitoring was designed for deterministic services, but agents are non-deterministic, multi-step, and often expensive in ways that standard dashboards do not reveal.
Azure AI Foundry, OpenTelemetry, and Azure Monitor give you a practical way to close that gap. In this guide, you will learn how to instrument an agent, trace its behavior, inspect its execution in Foundry and Application Insights, and apply evaluation signals to help govern quality and safety
Why agent observability is different
A conventional application trace answers two simple questions: did the request succeed, and how long did it take. An agent trace has to answer much more: what did the agent try to do, which tools did it call, what context did it use, and did its response stay grounded and safe.
That shift matters because an agent can return a perfectly healthy HTTP response while still hallucinating, looping through expensive reasoning steps, or using the wrong tool. In other words, operational success does not guarantee behavioral success.
Three signals matter especially in production:
Traces, so you can see the reasoning path and tool usage
Evaluation scores, so you can measure quality and safety over time
Token and latency metrics, so you can control cost and performance
What Foundry adds
Microsoft Foundry provides a native way to observe agents and generative AI applications, including trace views and evaluation workflows. In practice, your telemetry can flow through OpenTelemetry into Application Insights and Log Analytics, which lets you correlate agent behavior with the rest of your Azure estate
For agent observability, the biggest advantage is that traces are not just generic logs. Foundry and the related OpenTelemetry GenAI conventions expose agent- and tool-oriented context, which makes it easier to inspect what actually happened during a run. Microsoft's guidance also emphasizes that observability should capture run identifiers, tool invocations, request context, and quality signals in a way that supports incident response and governance
A good production strategy usually includes:
Semantic tracing for agent runs, tool calls, and model invocations
Evaluation for groundedness, relevance, and safety
Queryable telemetry in Application Insights and Log Analytics
Alerts for drift, failures, and cost anomalies
Framework support
Foundry can work with several agent stacks, but the amount of observability you get depends on the framework and the integration path. The more native the integration, the less custom tracing code you need to maintain
| Framework | Observability experience | Notes |
|---|---|---|
| Microsoft Agent Framework | Strong native experience | Best fit when you want the most integrated Foundry experience |
| Semantic Kernel | Good with configuration | Works well when you already use Semantic Kernel and want structured telemetry |
| LangChain | Good with tracer setup | Typically needs explicit tracing configuration and telemetry plumbing |
| LangGraph | Good with tracer setup | Similar to LangChain, with trace quality depending on your instrumentation approach |
| OpenAI Agents SDK | Most manual | Useful for custom runtimes, but you own more of the observability work |
The practical takeaway is simple: choose the framework that fits your engineering model, then make observability a first-class requirement from the start.
Demo architecture
This walkthrough uses a simple customer-support agent that checks order status and can escalate to a human if needed. The demo is intentionally small so the observability patterns are easy to understand and replicate in your own environment.
You will set up:
An Azure AI Foundry hub and project.
A GPT-4.0-mini deployment.
Application Insights connected to the project
A Python agent instrumented with OpenTelemetry
Evaluation and KQL queries for inspection and alerting
Prerequisites
Before you start, make sure you have:
An Azure subscription.
Python 3.11 or later.
Azure CLI installed and signed in.
An Azure AI Foundry hub and project.
A deployed model such as GPT-4.1 or GPT4.1-mini.
An Application Insights resource connected to your Foundry project.
Step 1: Create the Foundry project
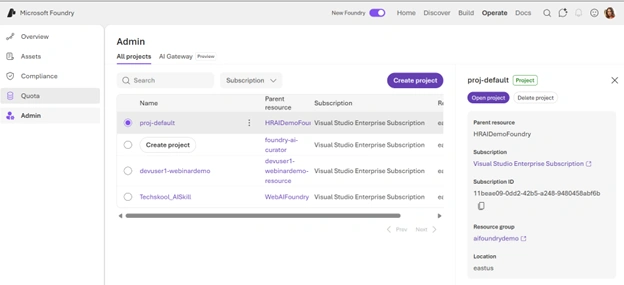
In the Azure portal, search for Azure AI Foundry and create a hub. Give the resource group, hub, and project clear names so they are easy to identify later, especially if you are running this in a shared subscription.
Once the hub exists, create a new project inside it. That project is where your model deployment, tracing, and evaluation resources will be organized
Step 2: Deploy a model
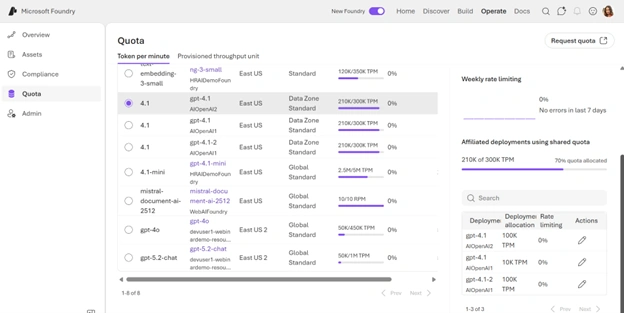
From the project, go to the Models + endpoints area and deploy a base model such as GPT-4o-mini. Use a clear deployment name, because you will reference it in code later.
For a demo, a modest quota is enough. In production, the quota should reflect expected concurrency, prompt size, and tool-call behavior.
Step 3: Connect Application Insights
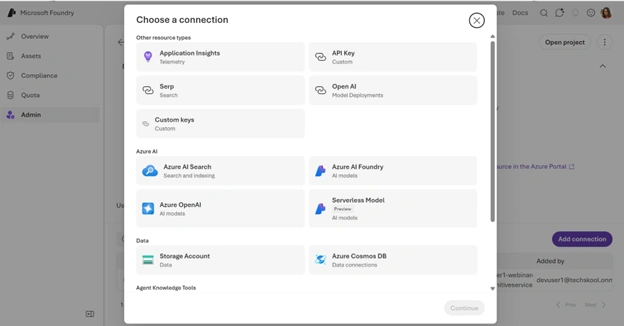
Link an Application Insights resource to the project so traces and metrics can flow into Azure Monitor. For most teams, workspace-based Application Insights is the better default because it gives you stronger Log Analytics integration and easier cross-service querying
Once connected, capture the Application Insights connection string and store it securely, not directly in source control. That connection string is what your application uses to export telemetry
Step 4: Prepare the Python environment
Create a project directory and a virtual environment. Then install the Azure, OpenTelemetry, and environment-variable packages needed by your sample.
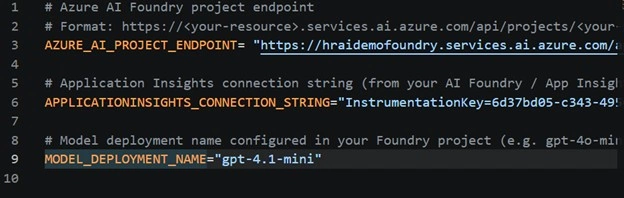
Use a .env file to store the project connection string, Application Insights connection string, and model deployment name. That keeps the demo repeatable without hardcoding secrets into the script.
Step 5: Instrument the agent
Your sample should do three things: connect to the Foundry project, define tools, and run the agent inside an OpenTelemetry span. The exact SDK APIs should match the current package version you are using, so treat the code below as a reference pattern rather than copy-paste pseudocode
python

import os
import time

from dotenv import load_dotenv
from azure.identity import DefaultAzureCredential
from azure.ai.projects import AIProjectClient
from azure.ai.projects.models import FunctionTool, ToolSet
from azure.monitor.opentelemetry import configure_azure_monitor
from opentelemetry import trace

load_dotenv()

configure_azure_monitor(
connection_string=os.getenv("APPLICATIONINSIGHTS_CONNECTION_STRING"),
service_name="order-support-agent",
service_version="1.0.0",
)

tracer = trace.get_tracer(__name__)

project = AIProjectClient.from_connection_string(
conn_str=os.getenv("AZURE_AI_PROJECT_CONNECTION_STRING"),
credential=DefaultAzureCredential(),
)

def get_order_status(order_id: str) -> str:
statuses = {
"ORD-001": "Shipped - expected delivery in 2 days",
"ORD-002": "Processing - not yet dispatched",
"ORD-003": "Delivered - signed for yesterday",
}
return statuses.get(order_id, "Order not found")

def escalate_to_human(reason: str) -> str:
return f"Escalated: {reason}. Ticket #{int(time.time())}"

tools = ToolSet()
tools.add(FunctionTool([get_order_status, escalate_to_human]))

agent = project.agents.create_agent(
model=os.getenv("MODEL_DEPLOYMENT_NAME"),
name="order-support-agent",
instructions=(
"You are a customer support agent for an e-commerce company. "
"Help customers track orders and resolve shipping issues. "
"Always look up the order status before responding. "
"Escalate to a human if the issue cannot be resolved."
),
tools=tools.definitions,
tool_resources=tools.resources,
)

thread = project.agents.create_thread()
project.agents.create_message(
thread_id=thread.id,
role="user",
content="Hi, I need help with order ORD-001. Where is it?",
)

with tracer.start_as_current_span(
"customer-support-session",
attributes={
"session.type": "order-enquiry",
"customer.tier": "premium",
"session.channel": "web",
},
) as span:
run = project.agents.create_and_process_run(
thread_id=thread.id,
agent_id=agent.id,
)
span.set_attribute("agent.run_id", run.id)
span.set_attribute("run.status", run.status)

messages = project.agents.list_messages(thread_id=thread.id)
last_msg = messages.get_last_text_message_by_role("assistant")
print(last_msg.text.value)

project.agents.delete_agent(agent.id)
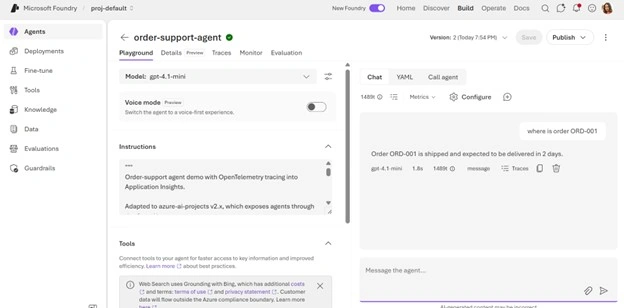
When this runs, you should see the agent answer the order question and observe traces in Application Insights and Foundry shortly afterward. The exact span names and attributes may vary by framework and SDK version, so validate them against the telemetry your integration emits.
Step 6: Inspect the trace
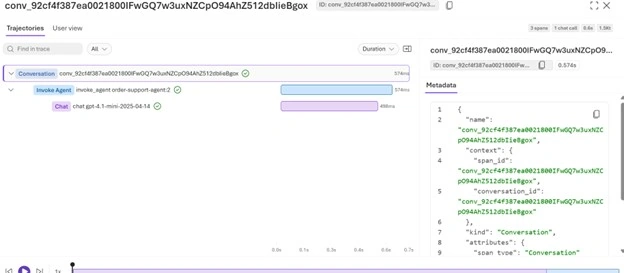
In the Foundry portal, open the tracing view for your project. You should see the session trace, with nested spans for the agent execution and the tool call sequence
A healthy trace for this demo usually shows:
A custom session span.
An agent run span
One or more model invocation spans.
A tool call span for order lookup.
The most useful detail is not just that the run succeeded, but that you can see the decision path behind the answer.
Step 7: Add evaluation
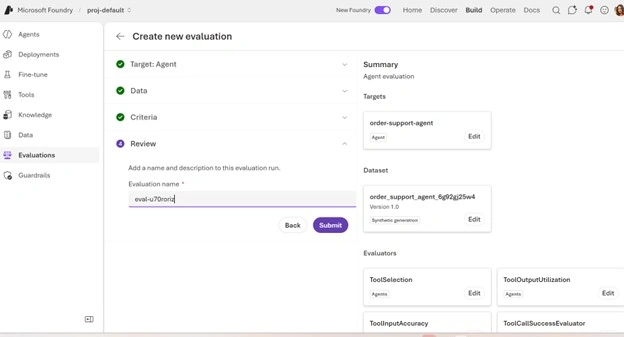
Foundry supports evaluations for generative AI apps and agents through the portal. For this demo, enable online evaluation and choose evaluators such as groundedness, relevance, and coherence or safety, depending on your use case.
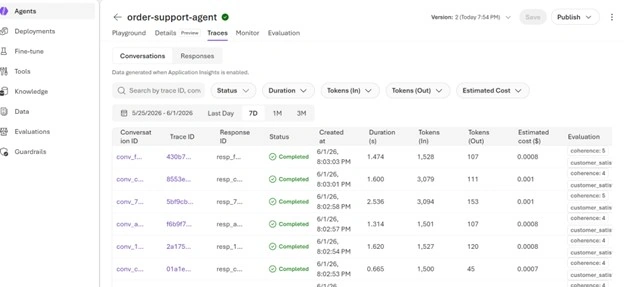
After evaluation is enabled, rerun the agent and inspect the new trace. Evaluation attributes should appear alongside the trace data, allowing you to compare behavior over time instead of relying on a single success/failure signal.
That is important because quality degradation often shows up before a full outage does. A prompt change, retrieval issue, or model update can subtly lower groundedness long before users file support tickets.
Step 8: Query the telemetry
Once your traces are in Application Insights, you can use KQL to inspect behavior and cost. The goal is not just to search logs, but to reconstruct decisions and spot trends
Here are four useful query patterns:
1. Agent runs with token usage
dependencies
| extend genAiOperation = tostring(customDimensions["gen_ai.operation.name"]),
         genAiAgentName = tostring(customDimensions["gen_ai.agent.name"]),
         inputTokens = tolong(customDimensions["gen_ai.usage.input_tokens"]),
         outputTokens = tolong(customDimensions["gen_ai.usage.output_tokens"])
| where isnotempty(genAiOperation) or isnotempty(genAiAgentName)
| summarize totalInputTokens = sum(coalesce(inputTokens, 0)), avgInputTokens = avg(inputTokens), totalOutputTokens = sum(coalesce(outputTokens, 0)), avgOutputTokens = avg(outputTokens) by genAiOperation, genAiAgentName
| order by totalInputTokens desc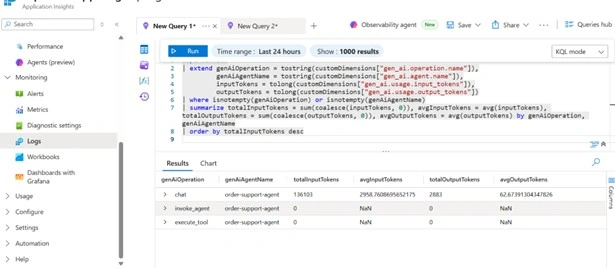
2. Full decision chain for one run
dependencies
| extend runId = tostring(customDimensions["gen_ai.agent.run.id"]),
         conversationId = tostring(customDimensions["gen_ai.conversation.id"]),
         toolName = tostring(customDimensions["tool.name"]),
         toolInput = tostring(customDimensions["tool.input"]),
         toolOutput = tostring(customDimensions["tool.output"])
| where runId == "<paste-run-id-here>" or conversationId == "<paste-run-id-here>"
| project timestamp, name, toolName, toolInput, toolOutput, duration
| order by timestamp asc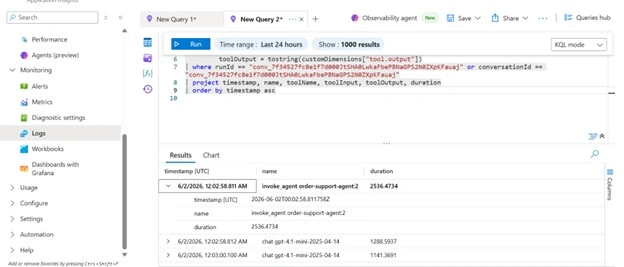
3. Quality trends over time
let metricMatches =
    customMetrics
    | where tolower(name) has_any ("quality", "score", "eval", "rating")
    | project timestamp,
              sourceTable = "customMetrics",
              metricName = name,
              value = todouble(value),
              valueCount,
              valueSum,
              valueMin,
              valueMax,
              customDimensions;
let eventMatches =
    customEvents
    | where name == "gen_ai.evaluation.result" or tostring(name) has_any ("quality", "score", "eval", "rating")
    | extend m = column_ifexists("customMeasurements", dynamic(null)),
             d = column_ifexists("customDimensions", dynamic(null))
    | mv-expand measurementKey = bag_keys(m)
    | extend measurementKey = tostring(measurementKey),
             measurementValue = todouble(m[tostring(measurementKey)])
    | where isempty(measurementKey) or measurementKey has_any ("quality", "score", "eval", "rating") or isnotnull(measurementValue)
    | project timestamp,
              sourceTable = "customEvents",
              metricName = iif(isempty(measurementKey), "<blank>", measurementKey),
              value = measurementValue,
              valueCount = int(null),
              valueSum = real(null),
              valueMin = real(null),
              valueMax = real(null),
              customDimensions = d;
metricMatches
| union eventMatches
| order by timestamp desc
| take 100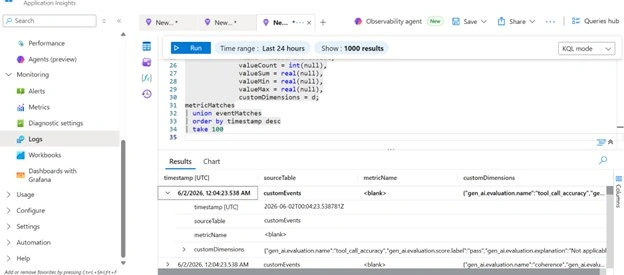
4. Token anomaly detection
dependencies
| extend genAiAgentName = tostring(customDimensions["gen_ai.agent.name"]),
         genAiOperation = tostring(customDimensions["gen_ai.operation.name"]),
         inputTokens = todouble(customDimensions["gen_ai.usage.input_tokens"]),
         outputTokens = todouble(customDimensions["gen_ai.usage.output_tokens"])
| where genAiAgentName == "order-support-agent" and genAiOperation == "chat"
| summarize inputTokens = sum(coalesce(inputTokens, 0.0)),
            outputTokens = sum(coalesce(outputTokens, 0.0))
    by ts = bin(timestamp, 1h)
| order by ts asc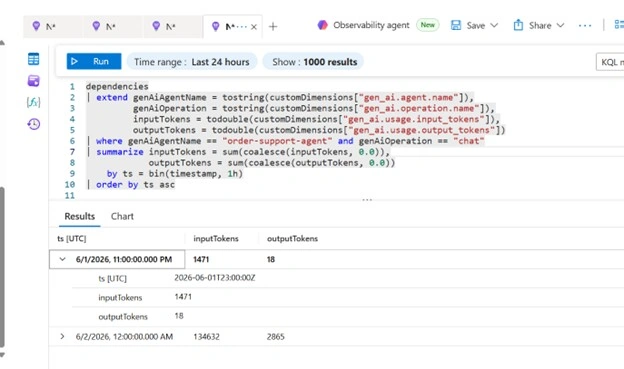
These queries are especially useful because they turn agent behavior into something you can trend, alert on, and explain to stakeholders. That is the difference between "we think the agent is working" and "we can prove how it behaved".
Step 9: Add alerts and governance
Once telemetry is flowing, create alerts for the signals that matter most to your business. Groundedness drops, token spikes, and tool-call failures are all reasonable production alert candidates
A useful starting point is:
Groundedness below threshold.
Relevance below threshold.
Token usage above anomaly baseline.
Tool-call failure rate above a defined percentage.
For governance, use managed identity and least privilege for the resources the agent can access, and keep audit-friendly telemetry that records run ID, tool usage, and model version. That gives you the forensic trail you need without relying on ad hoc manual reconstruction.
Step 10: Clean up
When you are finished, delete the resource group to avoid ongoing charges. That will remove the hub, project, deployment, Application Insights resource, workspace, and supporting infrastructure in one action.
If you want to preserve the traces, export the Log Analytics query results before deleting the resources. That is especially useful if you want to reuse the article as a demo deck or workshop lab later.
Final Takeaways
Agent observability is not a nice-to-have add-on. It is the foundation that makes an AI agent trustworthy enough for enterprise use. If you cannot see what the agent did, you cannot reliably debug it, govern it, or defend it
Azure AI Foundry gives you a practical path to that visibility through tracing, evaluation, and Azure Monitor integration. Start with telemetry wired in from day one, and your agent becomes a production system instead of a black box.
Join the conversation! Your thoughts help the community grow.