

Grafana 12.3 brings some exciting changes that make working with observability data easier than ever before. Whether you're just getting started with Grafana or have been using it for a while, this release has something valuable for everyone. Let me walk you through the most important updates in a way that's easy to understand.
Watch the Overview: For a quick visual introduction to Grafana 12.3.
What Makes Grafana 12.3 Special?
This release focuses on making your daily workflow smoother. The team behind Grafana has listened to user feedback and addressed real pain points. Instead of adding lots of flashy features, they've concentrated on making existing functionality work better and faster.
The Completely Redesigned Logs Panel
One of the biggest changes in version 12.3 is the brand new logs visualization panel. If you've ever worked with logs in Grafana, you know how important this is.
Deep Dive Video: Want to see the new logs panel in action?
What's Better About It?
The old logs panel worked, but it had some performance issues, especially when dealing with large amounts of log data. The new version has been rebuilt from scratch with several improvements:
Faster Performance: The new panel can handle more logs without slowing down your browser. This means you can analyze bigger datasets without frustration.
Better Pattern Recognition: Finding patterns in your logs is now much easier. The visualization helps you spot recurring issues quickly, which is crucial when you're troubleshooting problems.
Improved Context View: When you find an interesting log line, you can now see the surrounding context more clearly. This helps you understand what was happening before and after a particular event.
New Field Selector: You can now easily toggle which fields appear in your logs and change their order. This simple addition makes it much easier to focus on what matters to you.
Why Should You Care?
If you work with application logs, server logs, or any kind of system monitoring, this upgrade will save you time. Instead of scrolling through endless lines trying to find what you need, the new panel helps you get there faster.
Interactive Learning: Your Built-In Guide
Learning Grafana just got easier with the new interactive learning feature. This is particularly helpful if you're new to Grafana or learning advanced features.
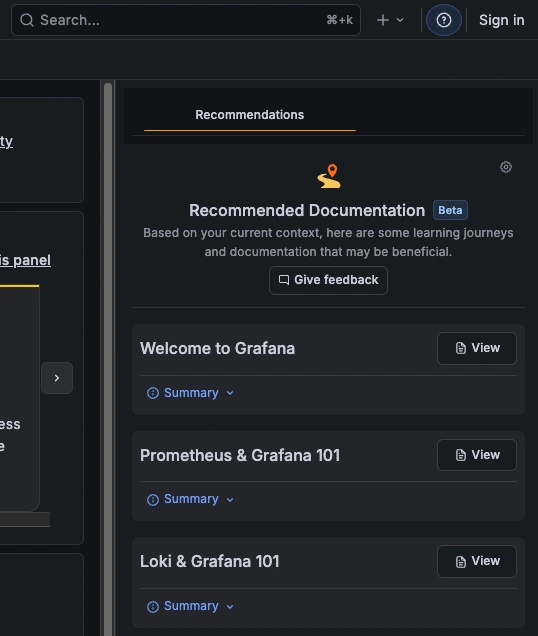
Interactive learning brings contextual help directly into Grafana
How It Works
Instead of having to leave Grafana to search for documentation, help now comes directly to you. When you're working on something, you'll see contextual tips and tutorials right where you need them.
Think of it like having a helpful colleague looking over your shoulder, ready to explain things when you need guidance. The system understands what you're doing and offers relevant documentation at just the right moment.
Perfect for Beginners
If you're just starting with Grafana, this feature is a game-changer. You don't need to become an expert before you start using Grafana effectively. The interactive learning guides you through tasks step by step.
Improved Dashboard Controls
Working with dashboards has become more intuitive in version 12.3. Two specific improvements stand out.
Panel Time Settings
Previously, if you wanted to adjust time settings for a specific panel, you had to edit the entire dashboard. Now, there's a dedicated "Panel time settings" drawer that lets you:
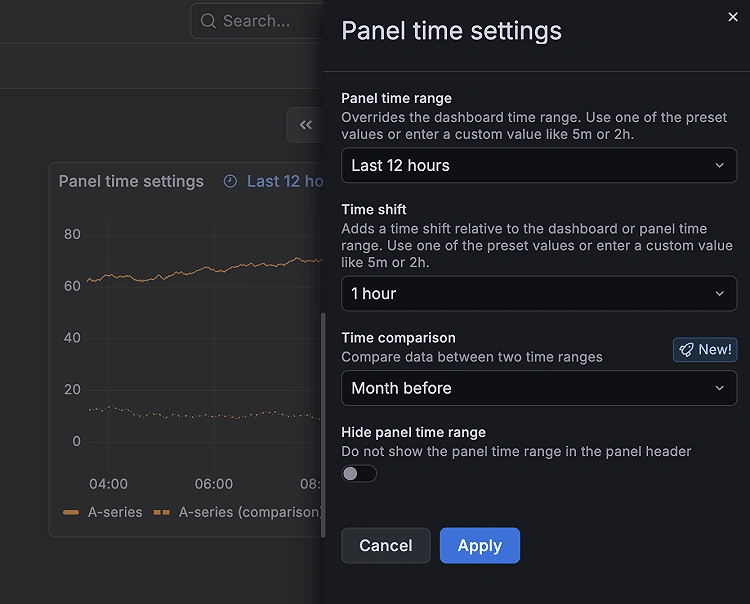
The new Panel time settings drawer makes time adjustments easier
Override the dashboard time range for individual panels
Compare different time periods side by side
Make quick adjustments without entering edit mode
This is incredibly useful when you want to look at historical data in one panel while keeping the rest of your dashboard showing current information.
Switch Variable Type
Variables in Grafana help you make dashboards dynamic. The new Switch variable type makes toggling between two values much simpler.
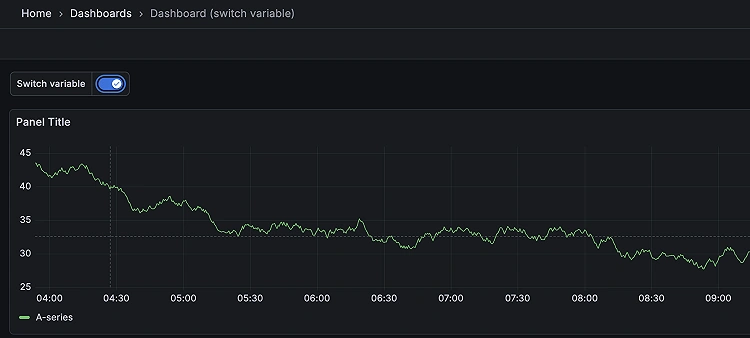
The Switch variable provides an intuitive toggle interface
Instead of a dropdown menu, you get a clean toggle switch. This works great for things like:
Turning debug mode on or off
Switching between production and staging environments
Enabling or disabling specific filters
It's a small change, but it makes dashboards feel more modern and easier to use.
Sharing Made Simple
Export Dashboards as Images
This might sound simple, but it's been a highly requested feature. You can now export any dashboard directly as a PNG image.
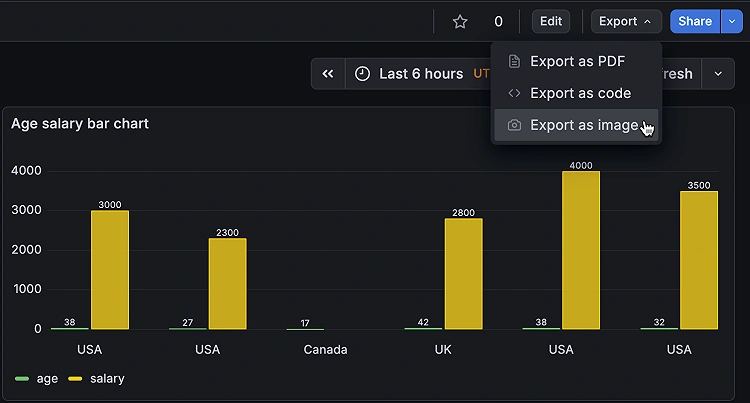
Dashboard export option makes sharing visualizations simple
Why is this useful? Sometimes you need to share your monitoring data with people who don't have access to Grafana. Maybe you're preparing a presentation, writing a report, or sending a status update. Instead of taking screenshots, you can export clean, professional-looking images directly from Grafana.
Saved Queries for Annotations
Annotations are those helpful markers you can add to dashboards to highlight important events. Now you can save annotation queries and reuse them across different dashboards.
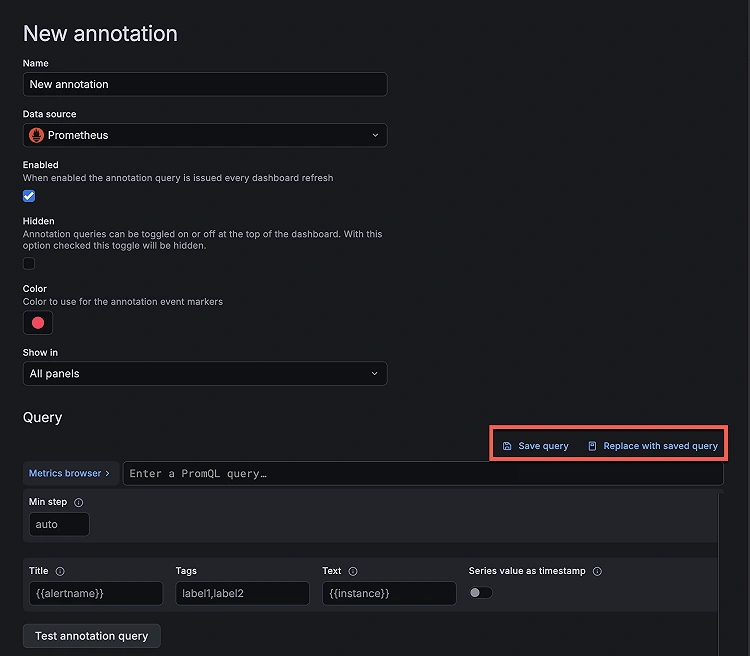
Save and reuse annotation queries across multiple dashboards
This means you don't have to recreate the same annotation setup every time. Save it once, use it everywhere. It's especially helpful for teams who want to maintain consistency across multiple dashboards.
Better Data Source Support
Grafana 12.3 expands what data you can visualize and how you can work with it.
New Support for SolarWinds
If your organization uses SolarWinds for network and infrastructure monitoring, you can now connect it directly to Grafana. This means you can combine SolarWinds data with other sources in unified dashboards.
Enhanced Honeycomb Integration
For teams using Honeycomb for observability, the new raw query support gives you more power. You can now use the full capabilities of the Honeycomb API directly within Grafana, including advanced querying features.
AWS CloudWatch Improvements
Two new features make working with CloudWatch logs more powerful:
Log Anomaly Detection: Automatically spot unusual patterns in your logs without manually searching for them.
Pattern Analysis: Group log entries that share similar patterns, making it easier to understand what's happening in your systems.
OpenSearch Gets Better
If you use OpenSearch, you'll appreciate the new PPL (Piped Processing Language) support. The query editor now includes:
Syntax highlighting
Auto-completion suggestions
Sample queries to help you get started
This makes writing queries faster and reduces errors.
Databricks Unity Catalog
For organizations using Databricks, Unity Catalog support means you can now query governed data directly from Grafana while maintaining all your security and compliance requirements.
Table Visualization Enhancements
Working with table data is now more flexible. You can style individual table cells using CSS properties, giving you fine-grained control over how your data looks.
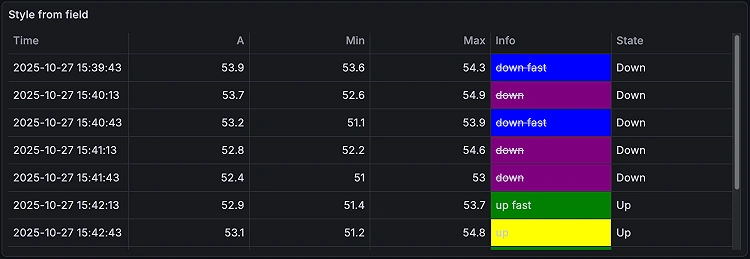
Apply custom CSS styling to individual table cells
This might seem like a minor detail, but it can make a big difference when you're trying to highlight important values or create professional-looking reports.
Important Changes to Know About
Every major release has some breaking changes. Here are the important ones you should be aware of:
API Keys Are Fully Gone
API keys were deprecated in an earlier version and have now been completely removed. If you haven't already, you should migrate to using service accounts instead. Service accounts are more secure and offer better control over permissions.
Permission Changes
There are two important changes to how permissions work:
Creator Permissions: Users won't automatically get admin rights to dashboards they create in nested folders anymore. They'll still get admin rights to items they create at the top level.
Provisioned Permissions: When you provision resources, it now completely replaces all existing permissions (except for the default admin role). This enforces a cleaner, more predictable permission model.
These changes might affect your workflows, so it's worth reviewing your current setup before upgrading.
Getting Started with Grafana 12.3
If you're new to Grafana, this is actually a great version to start with. The interactive learning feature will help you get up to speed quickly.
Here's a simple roadmap for beginners:
Start with a Simple Dashboard: Create a basic dashboard with one or two panels. The interactive learning will guide you through the process.
Try the New Logs Panel: If you have any log data, set up the new logs visualization. It's much easier to use than previous versions.
Experiment with Variables: Try creating a Switch variable to see how dynamic dashboards work.
Explore Data Sources: Connect to whatever data sources you're already using. The improved query editors will help you get started.
Use the Time Settings: Practice using the new panel time settings drawer to compare different time periods.
Why This Release Matters
Grafana 12.3 isn't about revolutionary new features. Instead, it's about making Grafana work better for real-world use cases. The developers have focused on:
Performance: Things load faster and handle more data
Usability: Common tasks are easier to accomplish
Learning: New users can get productive more quickly
Integration: More data sources work better with Grafana
Practical Tips for Upgrading
Before you upgrade to version 12.3:
Check Your API Usage: Make sure you're not using API keys anywhere
Review Permissions: Understand how the permission changes might affect your setup
Test in Non-Production First: Always upgrade a test environment before touching production
Back Up Your Dashboards: Export important dashboards before upgrading
Read the Full Changelog: The official Grafana documentation has complete details on all changes
Looking Forward
Grafana continues to evolve based on user needs. Version 12.3 shows the team's commitment to making observability accessible to everyone, not just experts.
The focus on learning resources, improved performance, and better user experience means you can spend less time fighting with tools and more time understanding your data.
Conclusion
Grafana 12.3 brings meaningful improvements that make monitoring and observability more accessible. Whether you're tracking application performance, analyzing logs, or building dashboards for your team, this release has something that will make your work easier.
The redesigned logs panel alone is worth the upgrade if you work with log data regularly. Add in the interactive learning feature, improved time controls, and expanded data source support, and you have a solid release that builds on Grafana's strengths.
If you're new to Grafana, there's never been a better time to start. The interactive learning will guide you through the basics, and the improved interfaces make it easier to become productive quickly.
For existing users, the upgrade path is straightforward, and the benefits are immediate. Just be mindful of the permission changes and make sure you've migrated away from API keys.
Remember, the goal of observability tools like Grafana is to help you understand your systems better. Version 12.3 takes another step toward making that understanding easier to achieve, regardless of your experience level.
References
Grafana Labs: What's New in Grafana v12.3 - Official Documentation.
Join the conversation! Your thoughts help the community grow.