
Background
For a long time in the software development world it was assumed that desktop applications will be dead. This misconception has existed for more than half of a decade. But it's not the reality because the Line Of Business (LOB) applications are still heavily used as desktop applications in various businesses, for example Reporting, Data analytics or simple data entry form application. Talking of desktop application comes with talking about Windows Forms and WPF.
Windows Forms and WPF
Windows Forms have remained as a part of software for a long time now. They have been upgraded to WPF because of the better UI and great user experience. Now WPF has been in the market for a long time. Developers were afraid that some other technology will soon be in the market to replace the WPF. It was obvious because we didn't hear anything related to WPF from Microsoft. But finally, we have some news and updates from Microsoft that will provide a great relief to developers and businesses. Because this time we have a great enhancement of WPF. This article will explain those important changes that will change the experience of WPF in terms of performance (many requests were raised regarding the performance).
Improvements in WPF with .Net 4.6 and Visual Studio 2015
Profiling on the go: Now one can start profiling of WPF applications. The profiler provides the ability to choose either one or both between the CPU usage and Memory usage.
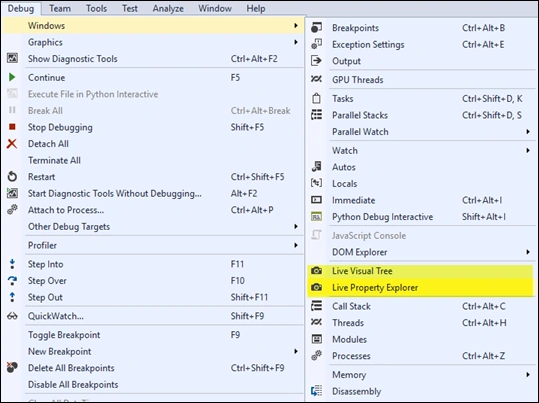
To Launch a profiler go to Debug –> Start Diagnostic tool without debugging. (A previous article explained that the Diagnostic tool is now part of the Debugging process.)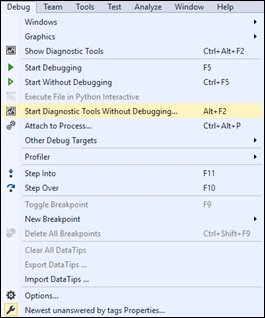
Figure 1: Debugging Process
Here's a preview of how the diagnostic will look like: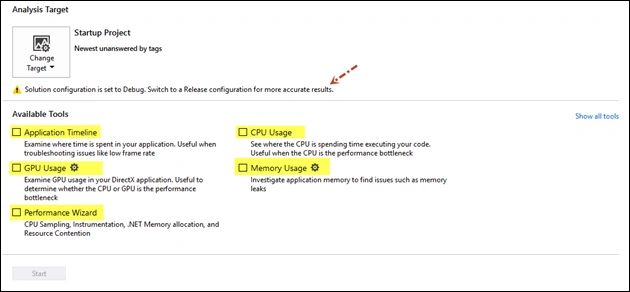
Figure 2: Analysis Target
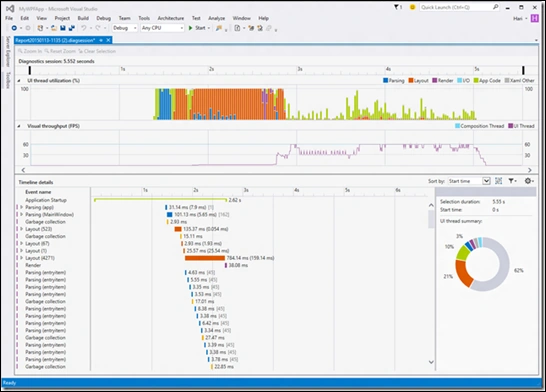
This might look like something like this when you select the options to diagnose and start diagnosis: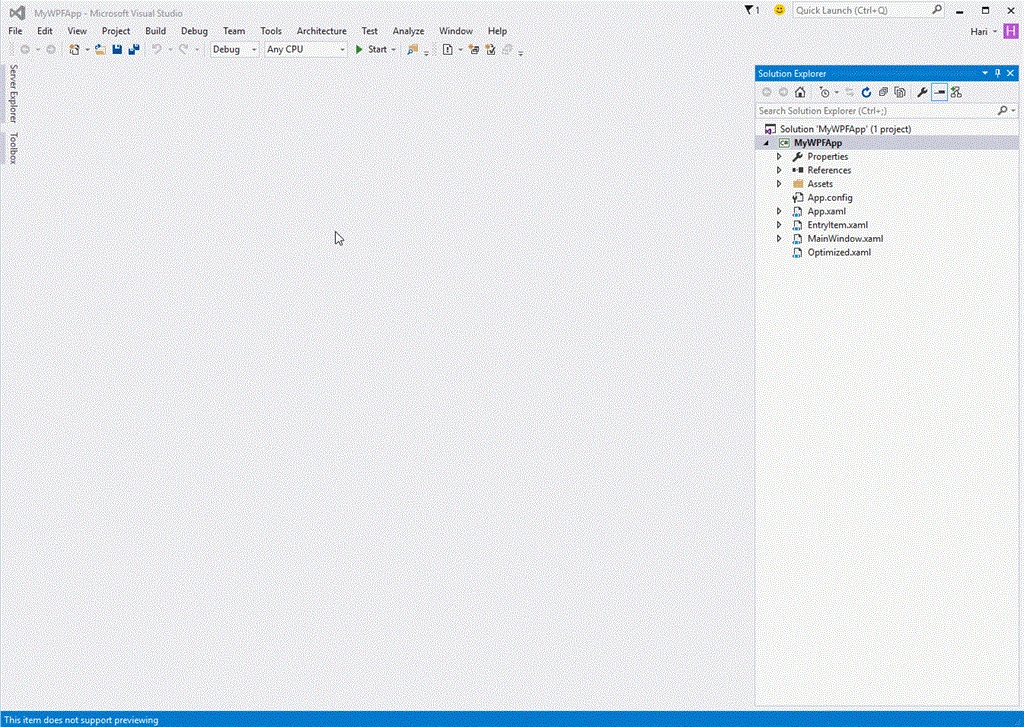
Figure 3: Start Diagnosis
(Note for the editor team: the preceding image is an animated image. Download the animated image from (http://blogs.msdn.com/cfs-filesystemfile.ashx/__key/communityserver-blogs-components-weblogfiles/00-00-01-38-64-metablogapi/4024.Start_5F00_thumb_5F00_56B71C4C.gif).

Enhancements in WPF in Visual Studio 2015 and .NET 4.6
Join the conversation! Your thoughts help the community grow.
Sign in to leave a comment
It is the same account you read, post and publish with — and you will come straight back to this page.

Yashwanth MuthineniPosted Aug 19, 2015, 6:02 AM
Nice share
Pankaj Kumar ChoudharyPosted Aug 16, 2015, 5:16 AM
Nice explain sir
Santhakumar MunuswamyPosted Aug 16, 2015, 2:19 AM
Good Article. Thanks for sharing
Karthikeyan KPosted Aug 15, 2015, 3:06 PM
Good one sir...Thanks for sharing
Mahesh ChandPosted Aug 15, 2015, 5:28 AM
Profiling is a good feature. A WPF application could be a resource pig in some areas but this new feature will help to identify the problem.
Nilesh JadavPosted Aug 15, 2015, 5:14 AM
Great Article sir
Sibeesh VenuPosted Aug 15, 2015, 4:38 AM
Nice Share :)
Rajeesh MenothPosted Aug 15, 2015, 3:32 AM
Nice Share
RakeshPosted Aug 15, 2015, 3:29 AM
Good one sir