Introduction
Much of Excel work is repetitive: writing formulas, cleaning inconsistent entries, building pivot tables, and preparing the same report every month. Copilot in Excel lets you do these tasks by describing what you want in plain English.
This article walks through 10 practical use cases. Each one uses the same small sample dataset, so you can follow along and verify the results yourself.
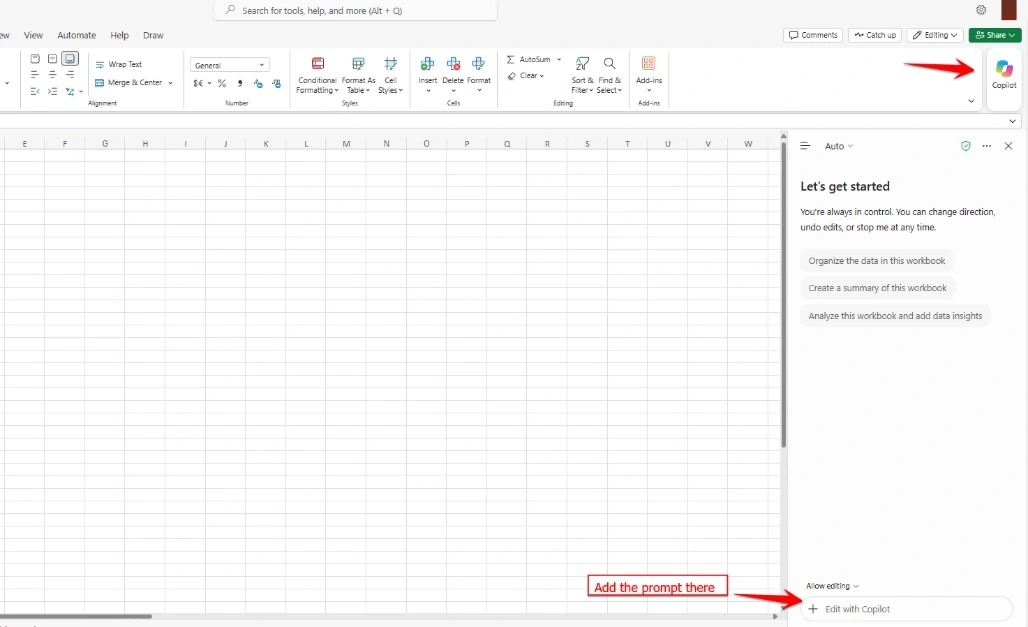
Prerequisites
A Microsoft 365 subscription with Copilot enabled
Your data formatted as an Excel Table (Insert → Table) with clear headers
The file saved in OneDrive or SharePoint
Sample Data
Create a table named SalesData with this data:
Month | Region | Product | Sales 2023 | Sales 2024 |
|---|
Jan | North | Software | 12,000 | 13,000 |
Feb | South | Hardware | 8,000 | 8,500 |
Mar | East | Services | 5,000 | 5,500 |
Apr | West | Software | 9,000 | 25,000 |
May | North | Hardware | 7,000 | 7,500 |
Jun | West | Services | 6,000 | 6,500 |
Totals: 2023 = 47,000 and 2024 = 66,000.
All numbers in this article are sample data for demonstration.
1. Summarize a Worksheet
Copilot reads your data and gives you the main takeaways, which is useful when you open a sheet someone else built.
Prompt: Summarize this worksheet.
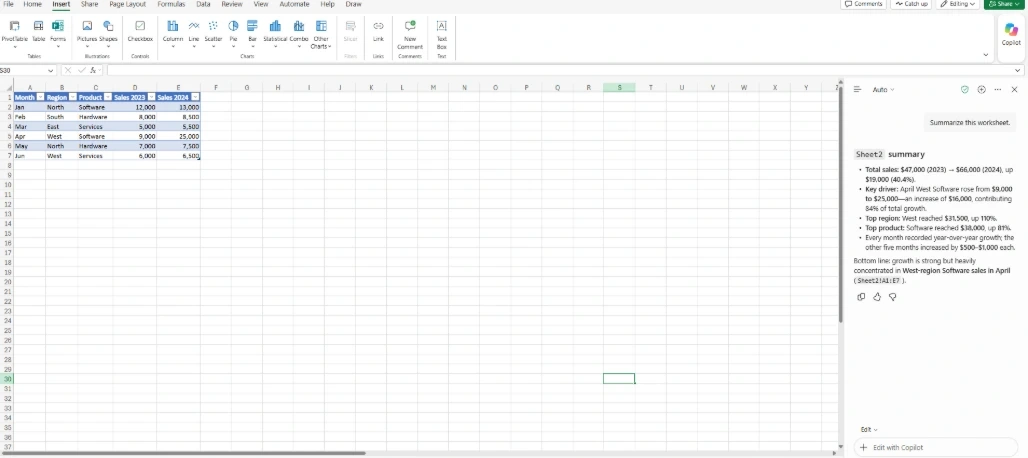
Example result:
The sheet contains sales data for 2023 and 2024 across 4 regions and 3 product categories
Total sales grew from 47,000 to 66,000 (about 40% growth)
West is the top region and Software is the top product
2. Spot Trends and Outliers
Instead of scanning rows, ask Copilot to find patterns and unusual values.
Prompt: Show me trends and any unusual values in Sales 2024.
Example result: Copilot flags April (West, Software) at 25,000, far above the other months, which range from 5,500 to 13,000. It can also add a line chart with the outlier highlighted. Checking whether this was a one-time deal or a data entry error is up to you.
3. Generate Formulas
Describe the calculation instead of remembering the syntax.
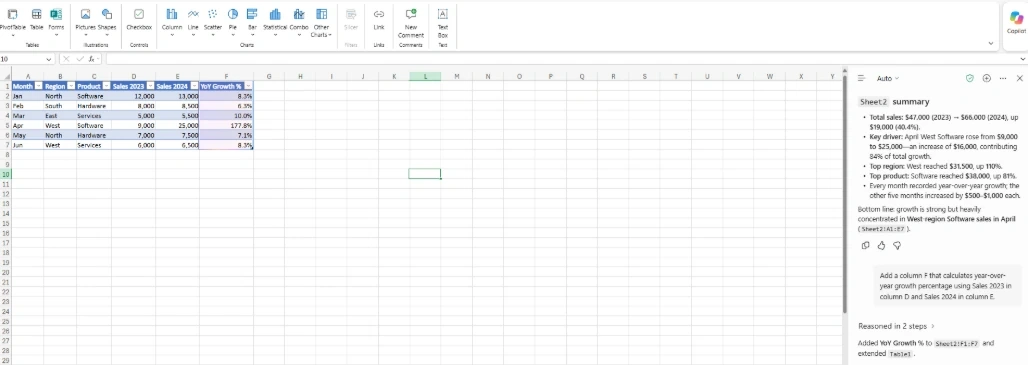
Prompt: Add a column F that calculates year-over-year growth percentage using Sales 2023 in column D and Sales 2024 in column E.
Formula Copilot suggests (in F2):
=(E2-D2)/D2
Format column F as a percentage and fill it down:
Month | Sales 2023 | Sales 2024 | Growth % |
|---|
Jan | 12,000 | 13,000 | 8.3% |
Feb | 8,000 | 8,500 | 6.3% |
Mar | 5,000 | 5,500 | 10.0% |
Apr | 9,000 | 25,000 | 177.8% |
May | 7,000 | 7,500 | 7.1% |
Jun | 6,000 | 6,500 | 8.3% |
April's 177.8% confirms the outlier from step 2.
4. Clean Messy Data
Suppose you have a separate Customer column with inconsistent entries:
Before | After |
|---|
ketan sathavara | Ketan Sathavara |
K Sathavara | Ketan Sathavara |
KETAN SATHAVARA | Ketan Sathavara |
Ketan, Sathavara | Ketan Sathavara |
Prompt: Standardize the names in the Customer column to First Last format with proper capitalization.
Always review the output. "J. Smith" is ambiguous and could be a different person.
New: the Get Data skill in Excel for the web can prepare and import data through Power Query. You describe what you need, and Copilot handles the connection and transformation.
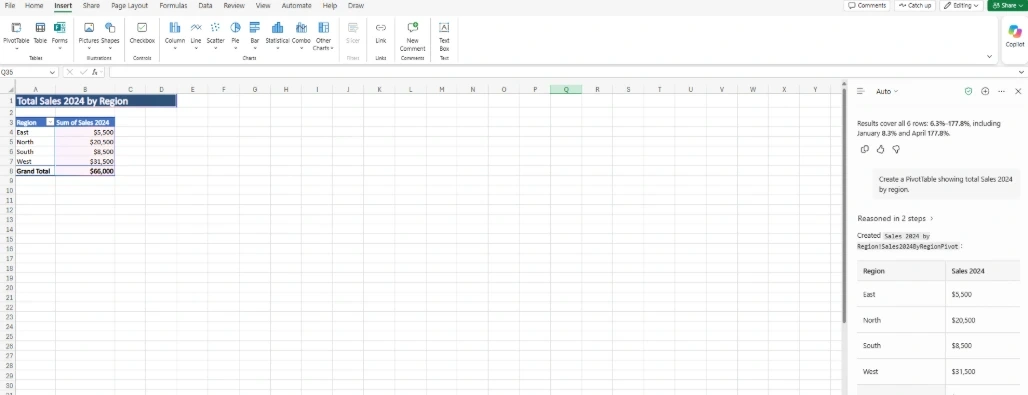
5. Build PivotTables
Prompt: Create a PivotTable showing total Sales 2024 by region.
Region | Sum of Sales 2024 |
|---|
East | 5,500 |
North | 20,500 |
South | 8,500 |
West | 31,500 |
Grand Total | 66,000 |
You can follow up with "Also split by product" to add a second grouping.
6. Create Charts
Prompt: Create a column chart of Sales 2024 by product.
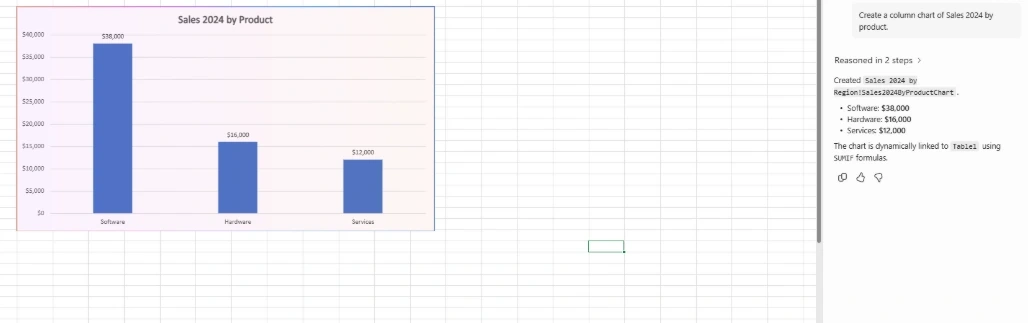
The chart data Copilot builds:
Product | Sales 2024 |
|---|
Software | 38,000 |
Hardware | 16,000 |
Services | 12,000 |
You can then ask: "Change it to a bar chart and use blue for Software."
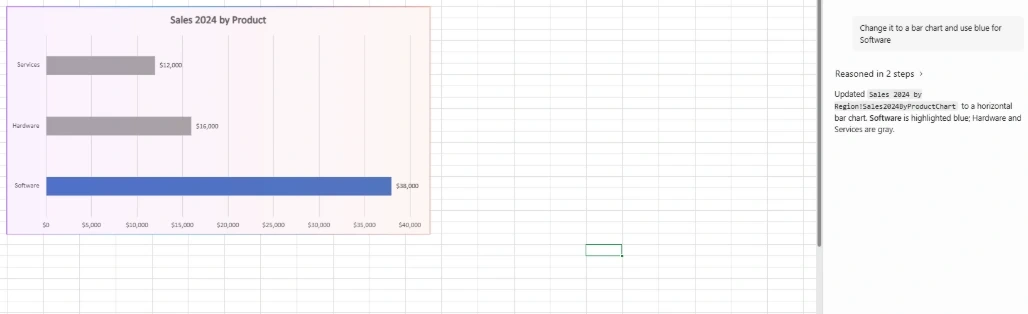
When Python is enabled, Copilot can also create charts and other visual outputs as part of your requested edits.
7. Ask Questions in Plain English
Prompt: Which region had the highest sales in 2024, and what share of the total is that?
Example answer: West had the highest sales at 31,500, which is about 47.7% of the 66,000 total.
Other questions you can try:
Copilot can now show inline citations and ground its analysis in Power BI data, so answers show where they come from.
8. Compare Scenarios
Prompt: What happens to total Sales 2024 if prices increase by 5%, 10%, and 15%?
Scenario | Total Sales | Change |
|---|
Current | 66,000 | – |
+5% | 69,300 | +5% |
+10% | 72,600 | +10% |
+15% | 75,900 | +15% |
This simple model assumes demand stays the same. In reality, higher prices often reduce volume, so treat the result as a starting point.
9. Find Key Insights
Prompt: What are the key insights from this data?
Example insights:
Sales grew about 40% year over year (47,000 to 66,000)
Software is the top product at about 58% of total sales
West contributes about 48% of sales
April had an unusual spike, so it is worth investigating
10. Speed Up Recurring Reporting
Prompt: Create a monthly sales report with a summary, key charts, and a brief analysis.
A typical output includes:
Conclusion
Copilot in Excel doesn't replace your analysis skills, but it removes much of the repetitive work. Start with one or two of these examples on your own data, then expand as you get better at writing prompts.


Join the conversation! Your thoughts help the community grow.