

Introduction
Grafana, a popular open-source analytics and visualization platform, empowers users to create insightful dashboards that provide real-time insights into various data sources. One such powerful integration is connecting a SQL Server data source to Grafana, enabling users to display, analyze, and monitor data from their SQL databases in a visually appealing and informative manner. In this article, we will guide you through the process of connecting a SQL Server data source to Grafana and creating a custom dashboard to display your data.
Prerequisites
Before we begin, make sure you have the following prerequisites in place:
- Grafana Installed: Ensure that you have Grafana installed and running on your server. (Refer to this article: How to Install Grafana on Windows?)
- SQL Server: Have access to a SQL Server database with the necessary data that you want to visualize.
Connecting SQL Server Data Source to Grafana
Follow these steps to connect your SQL Server data source to Grafana:
- Access Grafana: Open your web browser and navigate to your Grafana instance (usually http://localhost:3000 unless you've configured a different port).
- Login: Login to Grafana using your credentials.
- Add Data Source:
- Click on the Home icon on the left-hand sidebar to open the Connections menu. And click on Add new connection.
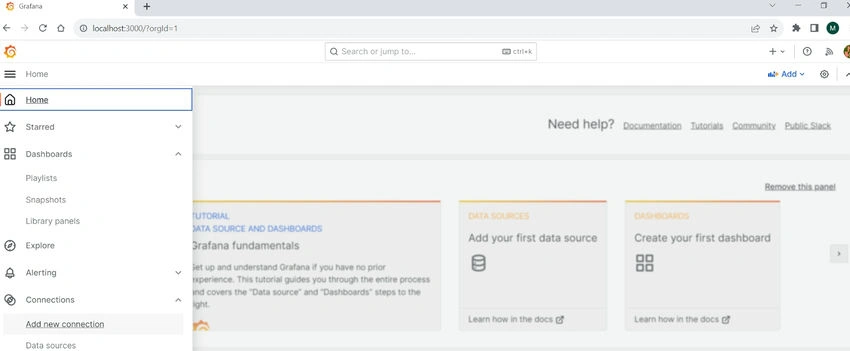
- Click on the Home icon on the left-hand sidebar to open the Connections menu. And click on Add new connection.
- Search for "SQL Server" in the available data source plugins.
- Click on "Microsoft SQL Server" to select it.
- Configure SQL Server Connection:

- Provide a name for your data source.
- In the "Host" field, enter the hostname or IP address of your SQL Server.
- Enter the database name you want to connect to.
- Provide the credentials (username and password) to access the database.
You can also configure optional settings such as "SSL mode" and "Instance name" if necessary.
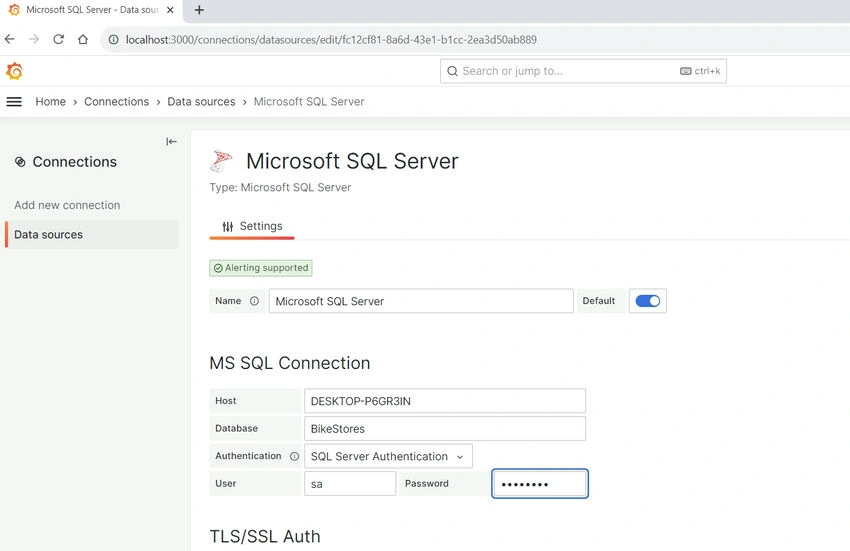
Test Connection: Click on the "Save & Test" button to test the connection to your SQL Server database.
And this error comes when TCP/IP not enable.
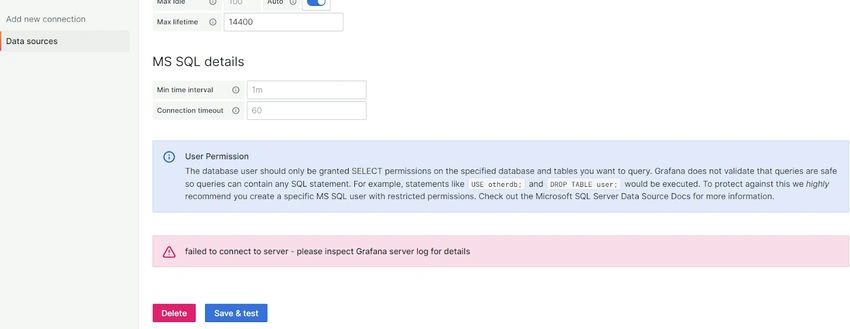
Note. failed to connect to the server - please inspect the Grafana server log for details.
Error message in a log file: level=error msg="Query error" error=" unable to open TCP connection with host 'DBServerName:1433': dial tcp [IP]:1433: connectex: No connection could be made because the target machine actively refused it."
Solution
You need to Go to Start > Microsoft SQL Server > Configuration Tools > SQL Server Configuration Manager.
When it opens, Go to SQL Server Configuration Manager > SQL Server Network Configuration > Protocols for SQLExpress, where you'll find the Protocol TCP/IP. If disabled, then Enable it. Click on TCP/IP, You'll find its properties.
In this property, Remove All the TCP Dynamic Ports. Add a value of 1433 to all TCP ports and restart your SQL Server Services > SQL Server.

And It's Done.
If the test is successful, you should see a confirmation message.
User Permission
The database user should only be granted SELECT permissions on the specified database and tables you want to query. Grafana does not validate that queries are safe so queries can contain any SQL statement. For example, statements like USE otherdb; and TABLE user; would be executed. To protect against this, we highly recommend you create a specific MS SQL user with restricted permissions. Check out the Microsoft SQL Server Data Source Docs for more information.
Creating a Dashboard in Grafana
Now that you have successfully connected your SQL Server data source let's create a custom dashboard to visualize your data:
- Access Dashboards
- Click on the "Home" icon on the left-hand sidebar to go to the Grafana home page.
- Select "Dashboards" from the sidebar.
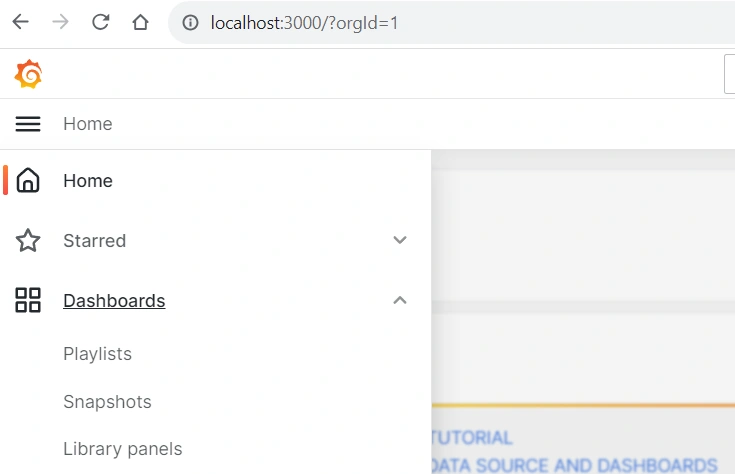
- Create Dashboard
- Click on the "New Dashboard" button.

- Click on the "New Dashboard" button.
- Add Panel
- Click on the "Add Panel" button to add a new panel to your dashboard.
- Choose the visualization type you want (e.g., Graph, Table, Singlestat, etc.).

- Configure Panel
- In the "Query" section, select your SQL Server data source from the dropdown.
- Write your SQL query to retrieve the data you want to display in the panel.
- Grafana supports both simple and complex SQL queries, including aggregations, joins, and custom calculations.

- Visualization Settings
- Configure the visualization settings, such as X-axis, Y-axis, legend, and colors, based on your data and preferences.
- Repeat for Additional Panels
- To add more panels to your dashboard, repeat steps 3 to 5 for each panel.

- To add more panels to your dashboard, repeat steps 3 to 5 for each panel.
- Save Dashboard
- After configuring your panels, click on the "Save" icon at the top of the page.
- Provide a name for your dashboard and choose the folder to save it in.

Conclusion
In this article, we explored how to connect a SQL Server data source to Grafana and create a custom dashboard to visualize your data. Grafana's intuitive interface and powerful features make it a fantastic tool for creating insightful and informative dashboards that enable data-driven decision-making. With your SQL Server data now seamlessly integrated into Grafana, you can monitor, analyze, and display your data in real-time, gaining valuable insights into your business processes or applications.
In my next article write about How to run Grafana on an IIS server.
Join the conversation! Your thoughts help the community grow.