One of the interesting ways to visualise project management data is through a Gantt Chart. Instead of presenting project activities in a traditional table, a Gantt Chart allows us to see how tasks are distributed across a timeline, when they start, when they finish, and how different activities overlap.
In this article, I will walk you through creating a Gantt Chart in Power BI Desktop using a sample project management dataset.
1. Prepare Your Dataset
The first step is to prepare a dataset containing the information required to build the Gantt Chart.
For this demonstration, I am using a sample data product development project with activities covering different stages of the project lifecycle.
My dataset contains the following columns:
Task Name: The name of each project activity.
Start Date: The date the activity is expected to begin.
End Date: The expected completion date.
% Complete: The percentage of work completed for each activity.
Phase: The project phase to which each task belongs.
Department: The department responsible for the activity.
Status: The current status of the activity.

Once the dataset is ready, import it into Power BI Desktop.
2. Add the Gantt Chart Visual
After loading the dataset, navigate to the Visualizations pane and add the Gantt Chart visual to your report canvas.
Depending on the Gantt Chart visual available in your Power BI environment, you may need to install it from Microsoft AppSource.
Once added, resize the visual to give it enough space to display the project activities and timeline properly.
3. Configure the Gantt Chart Fields
This is where we start building the actual visual.
Select the Gantt Chart visual and populate the available fields in the Build pane.
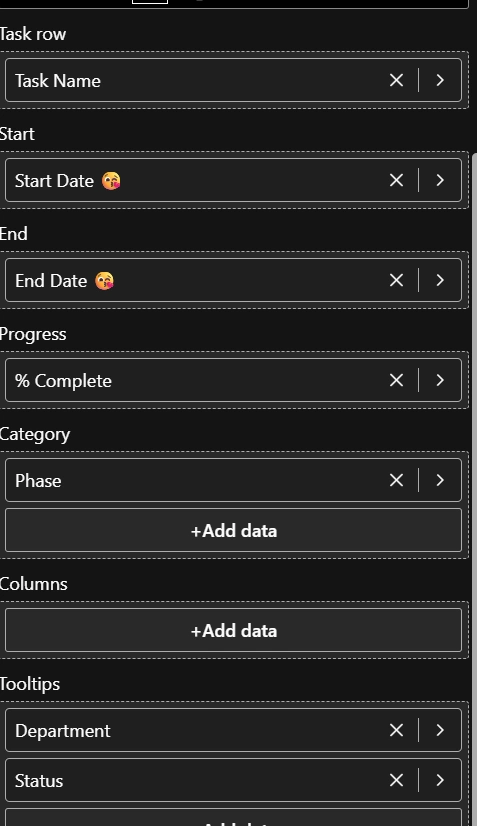
Here is how I have configured mine:
Gantt Chart Field | Dataset Column |
|---|
Task row | Task Name |
Start | Start Date |
End | End Date |
Progress | % Complete |
Category | Phase |
Tooltips | Department, Status |
Task row: Drag the Task Name column into this field. This tells Power BI the individual activities that should appear on the Gantt Chart.
Start: Add the Start Date column to indicate when each task begins.
End: Add the End Date column to indicate when each task is expected to finish.
Progress: Add the % Complete column. This allows the visual to represent how much of each activity has been completed.
Category: Add the Phase column to group related activities into project stages, such as Initiation, Planning, Design, Development, Reporting, Testing, Deployment, and Handover.
Tooltips: Add additional information such as Department and Status. This provides more context when interacting with individual tasks.
You should now start seeing your project activities displayed across a timeline.
4. Understanding the Gantt Chart
Once the fields have been configured, the Gantt Chart provides a visual representation of the entire project schedule.
In my example, the project is divided into different phases, with individual activities displayed underneath their respective categories.
The horizontal bars represent the duration of each activity, while their positions indicate the start and end dates.
For example, under the Planning phase, we have activities such as:
Moving further along the timeline, we can see activities under Design, Development, Reporting, Testing, Deployment, and Handover.
One interesting thing about this visual is that it makes overlapping activities easy to identify. For instance, data ingestion and transformation activities can run across overlapping periods.
This gives project managers a clearer understanding of how work is distributed throughout the project.
5. Format and Customise the Visual
After configuring the fields, the next step is to customise the Gantt Chart to make it more readable.
You can explore the formatting options available in your selected visual to adjust the appearance of the timeline, task bars, labels, categories, and other visual elements.
I particularly like grouping activities by project phase because it makes the report easier to understand.
You can also use additional fields in the Tooltips section to provide more information about individual tasks without overcrowding the report canvas.

6. Why Use a Gantt Chart in Power BI?
There are several reasons why I find Gantt Charts useful when building project management dashboards.
Project tracking: Easily monitor project activities and their scheduled timelines.
Progress monitoring: Understand how much work has been completed across different activities.
Task scheduling: Identify when activities begin and when they are expected to finish.
Resource visibility: Include department or resource information to understand who is responsible for different activities.
Project communication: Present complex project schedules in a visual format that stakeholders can easily understand.
Creating a Gantt Chart in Power BI Desktop provides an effective way to transform ordinary project management data into an interactive project timeline.
Rather than relying entirely on tables and spreadsheets, you can use this visual to understand project schedules, monitor progress, group activities into phases, and identify overlapping tasks.
If you work with project management data or build business intelligence solutions for project teams, I would definitely recommend exploring the Gantt Chart visual in Power BI.
Happy reporting! 🚀


Join the conversation! Your thoughts help the community grow.