

Introduction
This article explains how to work with Google Charts and also how Google Charts are better compared to Microsoft RDLC charts and Crystal Report Charts.
In most websites are static in the HTML and we cannot use our RDLC charts and Crystal Report Charts. Google Charts is useful if you have some static data to display. For that just create that data in JSON format and provide charts to display it.
- It works fine.
- Its free to use from Google.
- Google Charts are very interactive compared to RDLC and Crystal Reports.
- Easy to customize and design.
You can find a number of articles on this topic but they are not well explained with procedures. Here is a good example, read it once you will be a master.
Clean, Simple, Easy.
For more details visit: Google Charts.
If you want to develop RDLC charts then here is a useful article.
How to Create RDLC Charts and Complete Series of All Charts
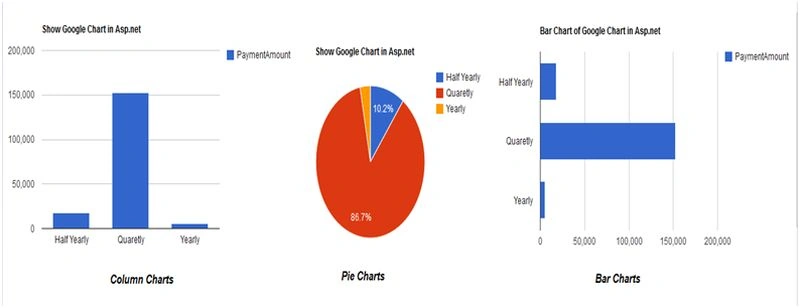
This article provides the following 3 examples (my favourite ones):
- Columns charts
- Pie Charts
- Bar Charts
Columns charts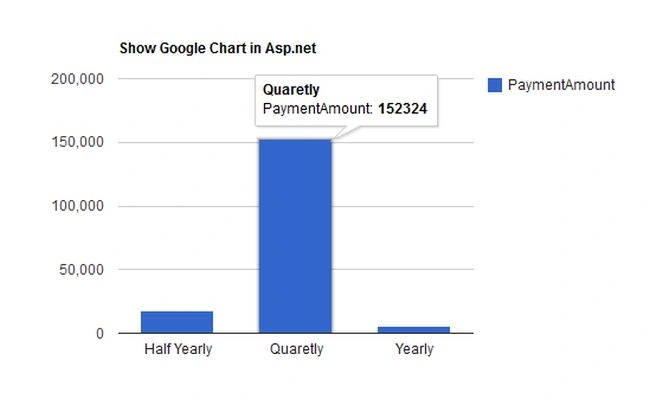
Pie Charts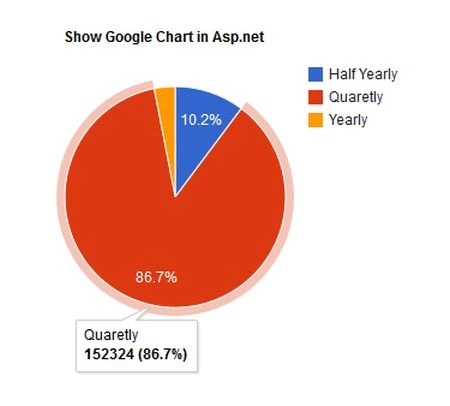
Bar Charts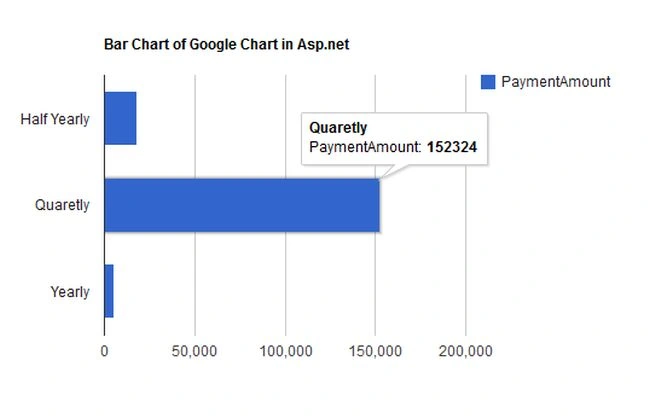
Images are used from: Using Google Charts.
Requirements for Developing Google Charts in ASP.NET
ASP.NET, SQL Server and a reference for the Google jsapi.
Step 1: SQL
In this I will show which table I am using and which type of query I am binding to the Google Charts.
Here I have used the following 2 tables:
- PaymentDetails
- PlanMaster
In the PlanMaster table I am storing all Plannames.
Here I am providing a Table Snapshot view. I will provide all the tables script and data for testing.
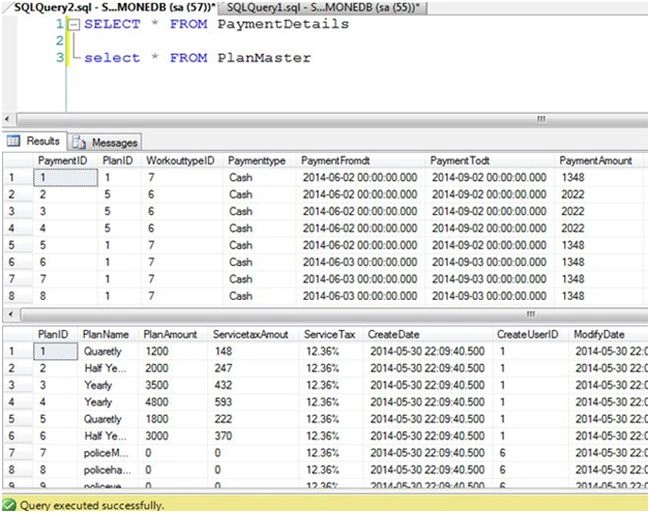
Here is the query that will get the records and we will bind them to the charts.
It's a normal query I have used. In a real scenario it would have many more tables.
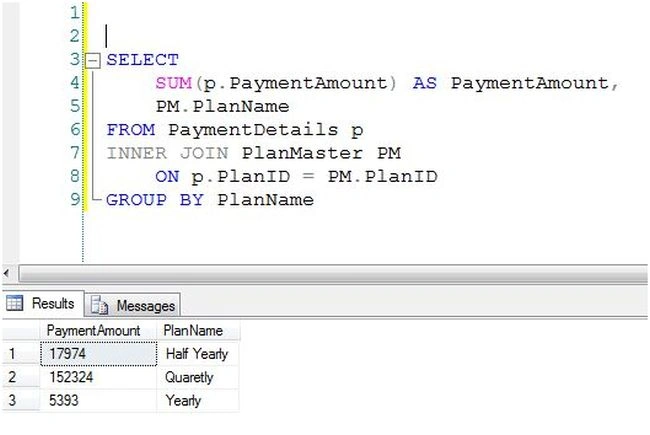
I have created a Stored Procedure for displaying the data.
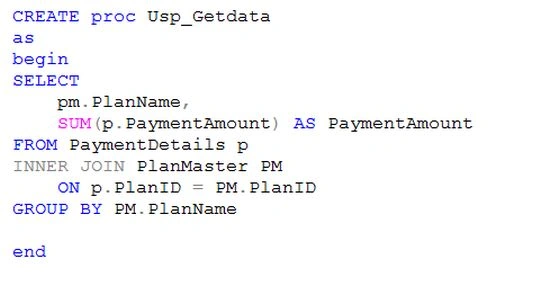
Hey we have now completed the SQL Server part. Now we are moving to C# and ASP.NET.
Step 2: Creating the ASP.NET Web Application
Create a new ASP.NET Web Application named WorkingwithGooglecharts and Select .Net Framework 4.0 when adding the project.
After adding you will get a blank solution with default stuff provided by the ASP.NET Web Application.
First I will show you how to create Column charts.
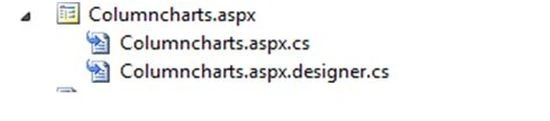
Add a new page to the project with the name Columncharts.aspx.
Step 3: Pass Data to Google Charts
After adding the page, the first step is to pass data to Google Charts.
Google Charts requires data in JSON format. For passing JSON data I am creating WebMethod.
Before WebMethod I have created a class with the name ChartDetails.
It will have the following 2 Properties:
- PlanName
- PaymentAmount
After adding the class I will now create a WebMethod of type ChartDetails.
Because I will pass a List of ChartDetails to JSON.
Then inside WebMethod I have created a SQL Connection for getting data.
After setting the Connection String, I have written a SQL command of type Stored Producre to get data from SQL Tables into a DataTable.
- SqlCommand cmd = new SqlCommand("Usp_Getdata", con);
- cmd.CommandType = CommandType.StoredProcedure;
- SqlDataAdapter da = new SqlDataAdapter();
- da.SelectCommand = cmd;
- DataTable dt = new DataTable();
- da.Fill(dt);
- List<ChartDetails> dataList = new List<ChartDetails>();
- foreach (DataRow dtrow in dt.Rows)
- {
- ChartDetails details = new ChartDetails();
- details.PlanName = dtrow[0].ToString();
- details.PaymentAmount = Convert.ToInt32(dtrow[1]);
- dataList.Add(details);
- }
- [WebMethod]
- public static List<ChartDetails> GetChartData()
- {
- using (SqlConnection con = new SqlConnection(ConfigurationManager.ConnectionStrings["GCConnectionString"].ToString()))
- {
- SqlCommand cmd = new SqlCommand("Usp_Getdata", con);
- cmd.CommandType = CommandType.StoredProcedure;
- SqlDataAdapter da = new SqlDataAdapter();
- da.SelectCommand = cmd;
- DataTable dt = new DataTable();
- da.Fill(dt);
- List<ChartDetails> dataList = new List<ChartDetails>();
- foreach (DataRow dtrow in dt.Rows)
- {
- ChartDetails details = new ChartDetails();
- details.PlanName = dtrow[0].ToString();
- details.PaymentAmount = Convert.ToInt32(dtrow[1]);
- dataList.Add(details);
- }
- return dataList;
- }
- }
Step 4: Google Charts Design
This is the design part of Google Charts.
First we need to create a goblal variable of Google Charts.
- <script type="text/javascript">
- // Global variable to hold data
- // Load the Visualization API and the piechart package.
- google.load('visualization', '1', { packages: ['corechart'] });
- </script>
I have created a function.
- $(function ()
- {
- $.ajax(
- {
- type: 'POST',
- dataType: 'json',
- contentType: 'application/json',
- url: 'ColumnChart.aspx/GetChartData',
- data: '{}',
- success: function (response)
- {
- drawchart(response.d); // calling method
- },
- error: function ()
- {
- alert("Error loading data! Please try again.");
- }
- });
- })
And on success I have called another function Draw chart to which I am passing the response that I am getting from Post.
- function drawchart(dataValues)
- {
- // Callback that creates and populates a data table,
- // instantiates the pie chart, passes in the data and
- // draws it.
- var data = new google.visualization.DataTable();
- data.addColumn('string', 'PlanName');
- data.addColumn('number', 'PaymentAmount');
- for (var i = 0; i < dataValues.length; i++)
- {
- data.addRow([dataValues[i].PlanName, dataValues[i].PaymentAmount] );
- }
- // Instantiate and draw our chart, passing in some options
- var chart = new google.visualization.ColumnChart(document.getElementById('chartdiv'));
- chart.draw(data,
- {
- title: "Show Google Chart in Asp.net",
- position: "top",
- fontsize: "14px",
- chartArea: { width: '50%' },
- });
- }
- var data = new google.visualization.DataTable();
- data.addColumn('string', 'PlanName');
- data.addColumn('number', 'PaymentAmount');
- for (var i = 0; i < dataValues.length; i++)
- {
- data.addRow([dataValues[i].PlanName, dataValues[i].PaymentAmount] );
- }
- var chart = new google.visualization.ColumnChart(document.getElementById('chartdiv'));
- chart.draw(data,
- {
- title: "Show Google Chart in Asp.net",
- position: "top",
- fontsize: "14px",
- chartArea: { width: '50%' },
- });
- <script type="text/javascript">
- $(function () {
- $.ajax({
- type: 'POST',
- dataType: 'json',
- contentType: 'application/json',
- url: 'ColumnChart.aspx/GetChartData',
- data: '{}',
- success: function (response) {
- drawchart(response.d); // calling method
- },
- error: function () {
- alert("Error loading data! Please try again.");
- }
- });
- })
- function drawchart(dataValues) {
- // Callback that creates and populates a data table,
- // instantiates the pie chart, passes in the data and
- // draws it.
- var data = new google.visualization.DataTable();
- data.addColumn('string', 'PlanName');
- data.addColumn('number', 'PaymentAmount');
- for (var i = 0; i < dataValues.length; i++)
- {
- data.addRow([dataValues[i].PlanName, dataValues[i].PaymentAmount] );
- }
- // Instantiate and draw our chart, passing in some options
- var chart = new google.visualization.ColumnChart(document.getElementById('chartdiv'));
- chart.draw(data,
- {
- title: "Show Google Chart in Asp.net",
- position: "top",
- fontsize: "14px",
- chartArea: { width: '50%' },
- });
- }
- </script>
The last thing is to display the chart. I used a div for this and given an id to it.
- <body>
- <form id="form1" runat="server">
- <div id="chartdiv" style="width: 600px; height: 350px;">
- </div>
- </form>
- </body>
Now just run the application and check it.
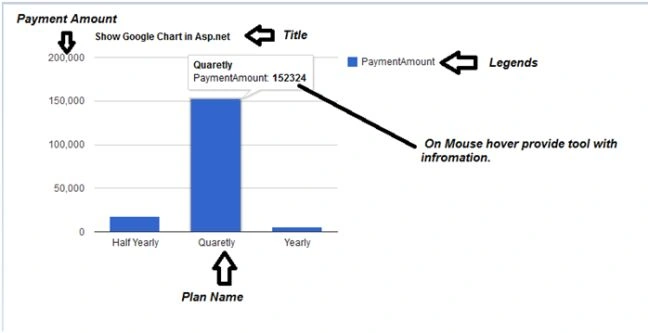
Here is the output of a Column Chart.
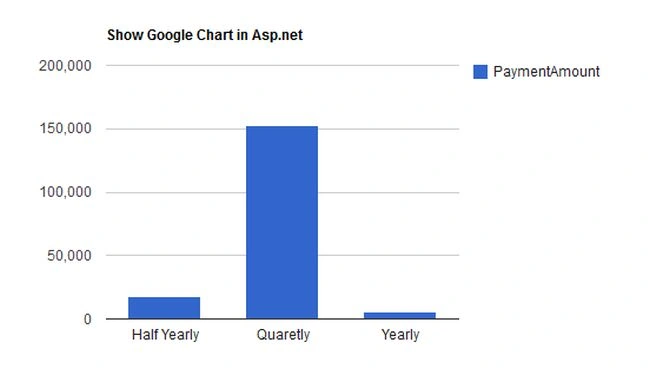
Here is how the data is displayed on charts.
Here are all the charts I have shown you.
You can download this charts attachment and check it. You will find all the examples and code related to it in details.
Samuel EliPosted Jul 5, 2023, 11:21 AM
Hello Bageri, thank you for the example however, i have a bit challenge, how can i use a stored connectionstring rather than the webconfig connectionstring
sdyjyws herstvicllwPosted Mar 11, 2021, 12:12 AM
XXXX.aspx:43 Uncaught ReferenceError: google is not defined
sdyjyws herstvicllwPosted Mar 11, 2021, 12:01 AM
Great article, thanks!
Ali bastugPosted Oct 30, 2020, 3:48 AM
Thanks but why can be local machine run but server not run what can be problem
piyush narkhedePosted Feb 13, 2017, 4:39 AM
Why I am getting error at 'ChartDetails'
Yashwanth MuthineniPosted Aug 27, 2015, 3:18 AM
Nice Share..Thanks
Manas MohapatraPosted Aug 5, 2015, 3:14 AM
Good one....
puspita pandaPosted May 19, 2015, 6:04 AM
Superb. But i need this chart will render in button click event and new value will bind with it. How can i do this, Plz help. Thanks,Puspita
vijay sivaPosted Oct 12, 2014, 7:10 PM
Thank you very much.
vijay sivaPosted Oct 12, 2014, 7:09 PM
Very nice article
Saineshwar BageriPosted Oct 9, 2014, 12:14 AM
thanks vithal sir
Vithal WadjePosted Oct 8, 2014, 3:18 PM
good one