
Introduction
In this post, I will explain to you how to create charts with jqPlot jQuery Plugin in ASP.NET MVC 4 using C# and Entity Framework, JSON.
What is JqPlot?
jqPlot is a plotting and charting plugin for the jQuery Javascript framework. jqPlot produces beautiful line, bar, and pie charts, with many features:
- Numerous chart style options.
- Date axes with customizable formatting.
- Up to 9 Y axes.
- Rotated axis text.
- Automatic trend line computation.
- Tooltips and data point highlighting.
- Sensible defaults for ease of use.

In this example, we will see how to use PieChart jqPlot.
SQL Database part
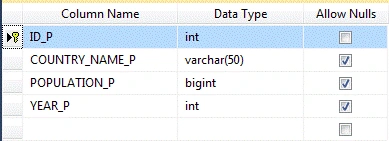
Create Table
You will find the table, given below, used in our application:
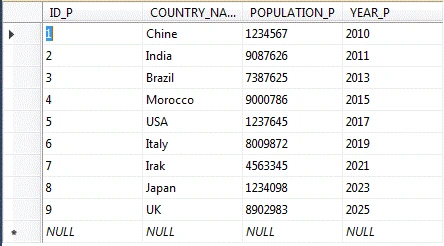
After creating the table, you can fill it using the data, as shown below:
Create your MVC application
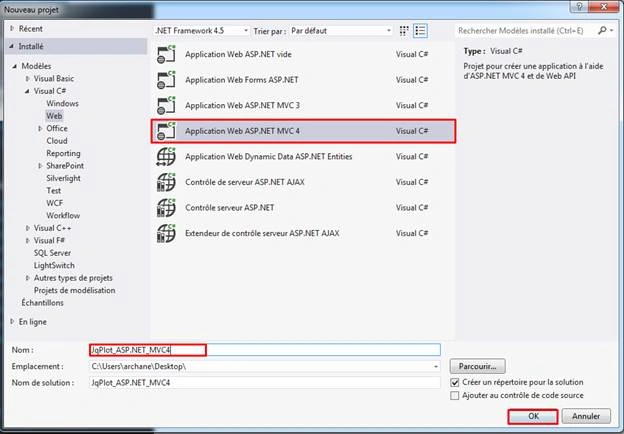
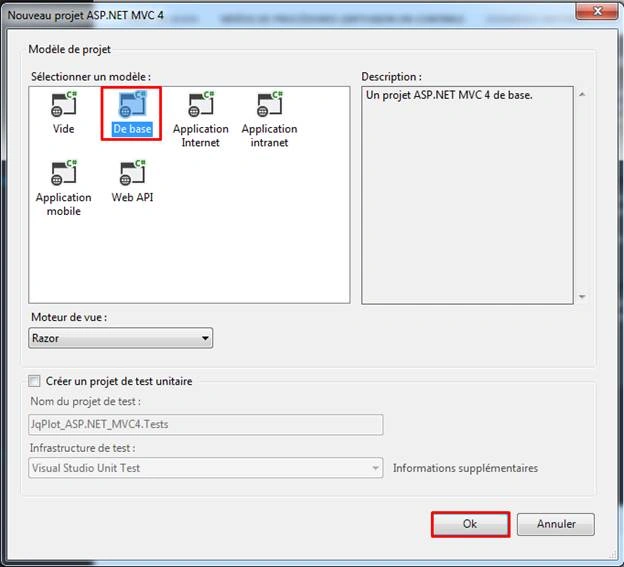
First, Open Visual Studio. Click on File > New > Project and name your project, as shown below:
Creating ADO.NET Entity Data Model
In this level, we need to create an Entity Data Model which allows us to retrieve data from database.
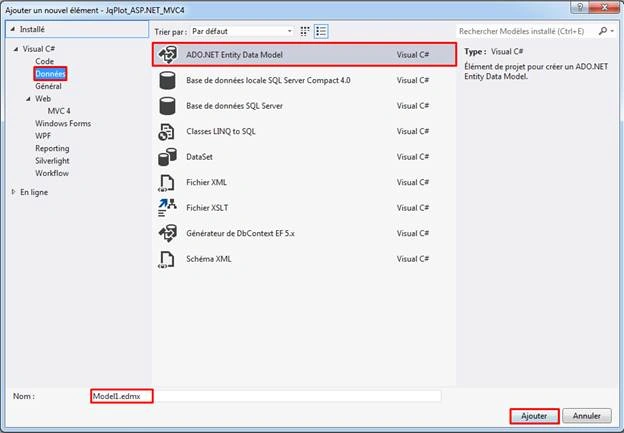
Right click on the project name. Click Add > Add New Item. In the dialog box displayed, select Data > Click Add button.
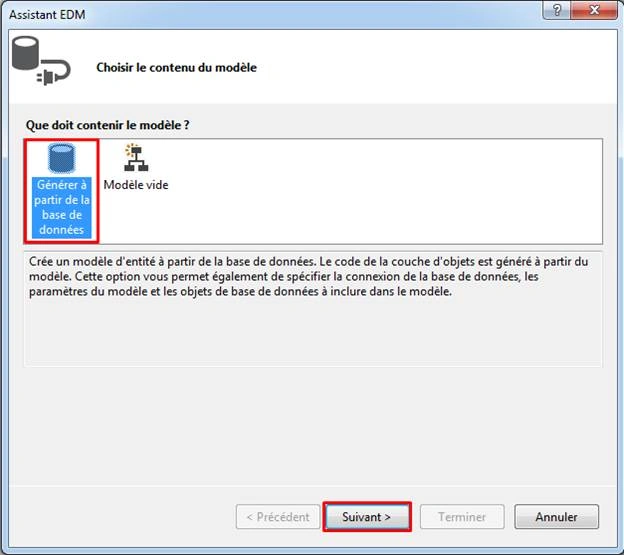
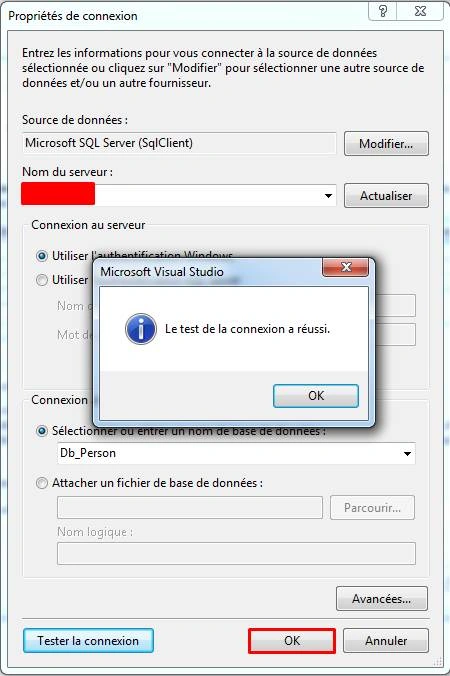
After clicking Next button, the dialog box will be displayed, as shown below. You need to choose your server name and select your database.
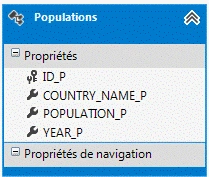
Finally, we see that EDMX model generates Populations class.
Create a controller
Now, we proceed to creating a controller. Right click on the controller folder > Add > Controller > Enter Controller name (‘Home Controller’).

HomeController.cs
- using System;
- using System.Collections.Generic;
- using System.Linq;
- using System.Web;
- using System.Web.Mvc;
- namespace JqPlot_ASP.NET_MVC4.Controllers
- {
- public class HomeController : Controller
- {
- //DbContext
- private Db_PersonEntities db = new Db_PersonEntities();
- // PieChart
- //
- // GET: /Home/
- public ActionResult PieRenderer()
- {
- return View();
- }
- public JsonResult GetPieRenderer()
- {
- var DbResult = from d in db.Populations
- select new
- {
- d.COUNTRY_NAME_P,
- d.POPULATION_P
- };
- return Json(DbResult, JsonRequestBehavior.AllowGet);
- }
- }
- }
Creating a strongly typed view
We are going to create a strongly typed View.
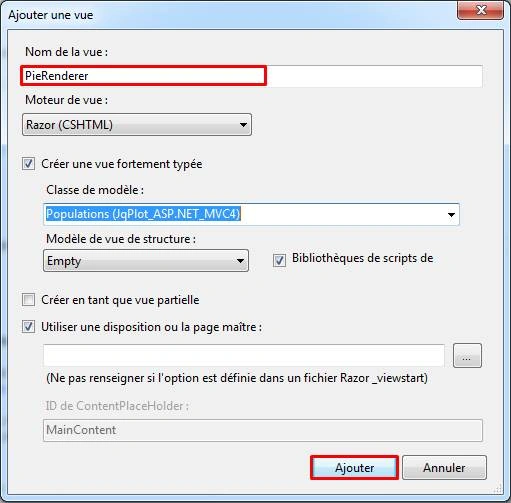
PieRenderer.cshtml
- @model JqPlot_ASP.NET_MVC4.Populations
- @{
- ViewBag.Title = "PieRenderer";
- }
- <h2>PieRenderer</h2>
- <div id="chartdiv" style="height: 400px; width: 500px;"></div>
- @section scripts {
- <!-- CSS -->
- <link href="~/Content/jquery.jqplot.min.css" rel="stylesheet" />
- <!-- Scripts JS -->
- <script src="~/Scripts/jquery-1.7.1.min.js"></script>
- <script src="~/Scripts/jquery.jqplot.min.js"></script>
- <script src="~/Scripts/jqplot.pieRenderer.js"></script>
- <script type="text/javascript">
- $(document).ready(function () {
- $.ajax({
- type: "POST",
- url: "Home/GetPieRenderer",
- contentType: "application/json; charset=utf-8",
- dataType: "json",
- success: OnSuccess,
- error: OnError
- });
- function OnSuccess(response) {
- var aData = response;
- var dataArray = [];
- $.each(aData, function (i, item) {
- dataArray.push([item.COUNTRY_NAME_P, item.POPULATION_P]);
- });
- var plot1 = jQuery.jqplot('chartdiv', [dataArray],
- {
- seriesDefaults: {
- // Make this a pie chart.
- renderer: jQuery.jqplot.PieRenderer,
- rendererOptions: {
- sliceMargin: 4,
- // Put data labels on the pie slices.
- showDataLabels: true
- }
- },
- legend: { show: true, location: 'e' }
- }
- );
- }
- function OnError(response) {
- alert("Error !");
- }
- });
- </script>
- }
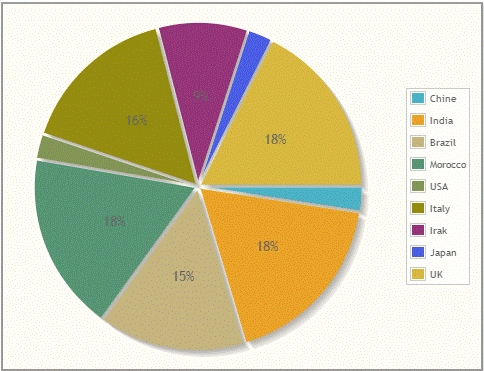
For any details related jqPlot, you can use the link below:
URL: jqplot
Ravi ChudasamaPosted Jan 30, 2019, 7:54 AM
Plsss help me soluation this error
Ravi ChudasamaPosted Jan 30, 2019, 7:53 AM
Uncaught TypeError: Cannot read property 'PieRenderer' of undefined
kalu singh raoPosted Jul 21, 2016, 1:38 AM
Nice Articles...
Akshay PhadkePosted Jul 21, 2016, 12:14 AM
I think so it has been done :)