

Graphs and charts are useful for visualizing and summarizing data for our users but in Windows 10 Universal app there is no default XAML control in Visual Studio for graphs and charts so we need to use other libraries paid or free such as WinRT XAML Toolkit or TelerikRadControls for Windows UWP.
Let’s see the steps.
Create new Windows 10 universal project.
Then we need to add WinRTXaml Toolkit reference.
Right-click References in Solution Explorer, select Manage NuGet Packages, search WinRTXamlToolkit.Controls.DataVisualization.UWP and install it like the following screen.
After successful installation go to your UI page “MainPage.XAML” and write the following code.
Then add the following namespace in your XAML file.
xmlns:Charting="using:WinRTXamlToolkit.Controls.DataVisualization.Charting"
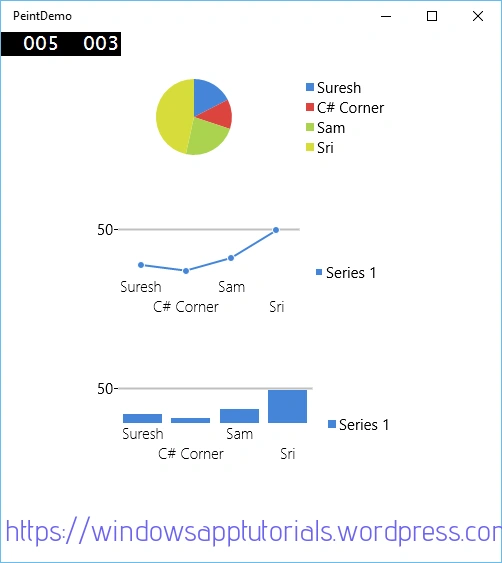
Now design the required chart and here I am going to add three charts: pie chart, line chart and column chart using the following code.
- <Charting:Chart
- x:Name="PieChart"
- HorizontalAlignment="Left"
- VerticalAlignment="Top"
- Margin="0" Width="323" >
- <Charting:PieSeries Margin="0"
- IndependentValuePath="Name"
- DependentValuePath="Amount"
- IsSelectionEnabled="True"/>
- </Charting:Chart>
- <Charting:Chart
- x:Name="lineChart"
- HorizontalAlignment="Left"
- VerticalAlignment="Top"
- Margin="0" Height="159" Width="316" >
- <Charting:LineSeries Margin="0"
- IndependentValuePath="Name"
- DependentValuePath="Amount"
- IsSelectionEnabled="True"/>
- </Charting:Chart>
- <Charting:Chart
- x:Name="ColumnChart"
- HorizontalAlignment="Left"
- VerticalAlignment="Top"
- Margin="0" Width="329" >
- <Charting:ColumnSeries Margin="0"
- IndependentValuePath="Name"
- DependentValuePath="Amount"CharacterSpacing="5"
- IsSelectionEnabled="True"/>
- </Charting:Chart>
- publicclassRecords
- {
- publicstring Name
- {
- get;
- set;
- }
- publicint Amount
- {
- get;
- set;
- }
- }
- publicMainPage()
- {
- this.InitializeComponent();
- LoadChartContents();
- }
- privatevoidLoadChartContents()
- {
- Random rand = newRandom();
- List < Records > records = newList < Records > ();
- records.Add(newRecords()
- {
- Name = "Suresh", Amount = rand.Next(0, 200)
- });
- records.Add(newRecords()
- {
- Name = "C# Corner", Amount = rand.Next(0, 200)
- });
- records.Add(newRecords()
- {
- Name = "Sam", Amount = rand.Next(0, 200)
- });
- records.Add(newRecords()
- {
- Name = "Sri", Amount = rand.Next(0, 200)
- });
- (PieChart.Series[0] asPieSeries).ItemsSource = records;
- (ColumnChart.Series[0] asColumnSeries).ItemsSource = records;
- (lineChart.Series[0] asLineSeries).ItemsSource = records;
- }
For more information on Windows 10 UWP, refer my e-book:
Yoav TamariPosted Aug 6, 2019, 4:40 AM
Very nice!
Ashish PrasadPosted Jan 20, 2018, 10:53 PM
(PieChart.Series[0] as PieSeries).ItemsSource = records; (ColumnChart.Series[0] as ColumnSeries).ItemsSource = records; (lineChart.Series[0] as LineSeries).ItemsSource = records; it was saying showing an error The name piechart does not current context same error for linechart and Column chart
Debasis SahaPosted Apr 9, 2016, 2:05 AM
Good share..
Vignesh ManiPosted Apr 8, 2016, 5:09 PM
Nice
Mohammed IbrahimPosted Apr 8, 2016, 2:26 PM
nice
Gowtham RajamanickamPosted Apr 8, 2016, 8:46 AM
Good one..