

Introduction
A great report is not just about numbers—it’s about storytelling and visual appeal. While charts and KPIs drive insights, images help create context, branding, and clarity in your reports.
Whether you’re adding a company logo, background design, or dynamic product images, Microsoft Power BI provides multiple ways to seamlessly integrate images into your reports.
In this article, you’ll learn how to insert images into Power BI, along with practical use cases and best practices.
Why Use Images in Power BI Reports?
Before jumping into the “how,” let’s understand the “why.”
Images in Power BI can be used to:
Reinforce branding (logos, themes)
Improve user experience
Provide visual context (e.g., product images)
Enhance storytelling
Make reports more engaging and professional
Method 1: Insert a Static Image (Logo, Background, Icons)
This is the most common and straightforward method.
Steps to Insert a Static Image
Open your report in Power BI Desktop
Navigate to the Insert tab
Click on Image
In the Format image task pane, expand style and image

Browse and select your image file (PNG, JPG, SVG, etc.)
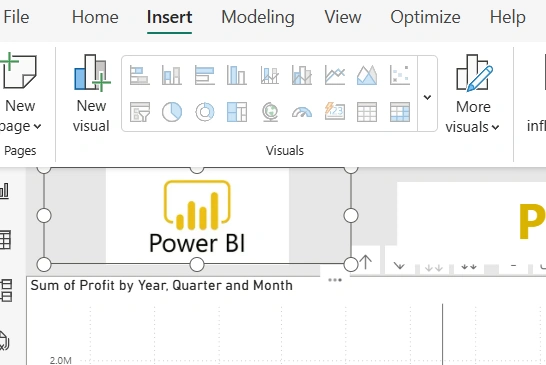
As seen below, we have a Power BI image inserted
Common Use Cases
Company logos
Dashboard headers
Background images
Icons for navigation
Method 2: Set an Image as a Page Background
Instead of placing an image as a visual, you can use it as a background.
Steps
Click anywhere on the report canvas (no visual selected)
Go to the Format pane
Expand Canvas background
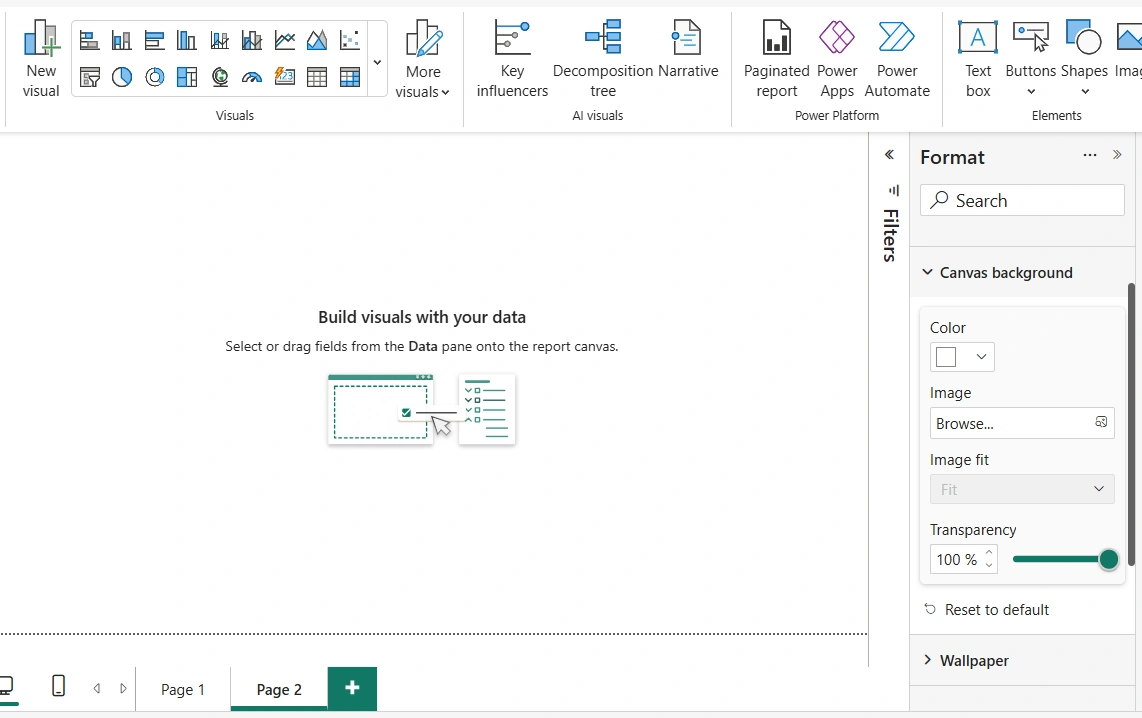
Upload your image
Adjust:
Transparency
Fit (Fill, Fit, Normal)
As seen below, we have an image as a backgroup

Pro Tip
Use subtle backgrounds with high transparency to avoid distracting from your data.
Best Practices for Using Images in Power BI
To keep your reports professional and performant, follow these tips:
1. Optimize Image Size
Large images can slow down report performance.
✔ Compress images before uploading
✔ Use appropriate formats (PNG for transparency, JPG for photos)
2. Maintain Consistent Branding
Use:
Same logo placement
Consistent colors
Standard icon sets
This improves usability and professionalism.
3. Avoid Overcrowding
Too many images can distract users.
✔ Keep design clean
✔ Prioritize data over decoration
4. Use Transparent Backgrounds
Logos and icons look cleaner when saved as PNG with transparency.
5. Test Across Devices
Ensure images display correctly on:
Desktop
Tablet
Mobile layout
In conclusion, adding images in Microsoft Power BI is simple but using them effectively is what makes the difference.
From static logos to dynamic, data-driven visuals, images help you:
Communicate better
Design smarter
Deliver impactful reports
When combined with strong data modeling and visuals, images elevate your reports from informative to unforgettable.
Join the conversation! Your thoughts help the community grow.