

I have created a GraphChart project using VB.NET (2010), my project has the following six forms:
- frmChart: This is the main form to choose the type of the chart.
- frmGraph1: Binding the chart to an array from a DataGrid with (DataBindXY) and showing the following chart:
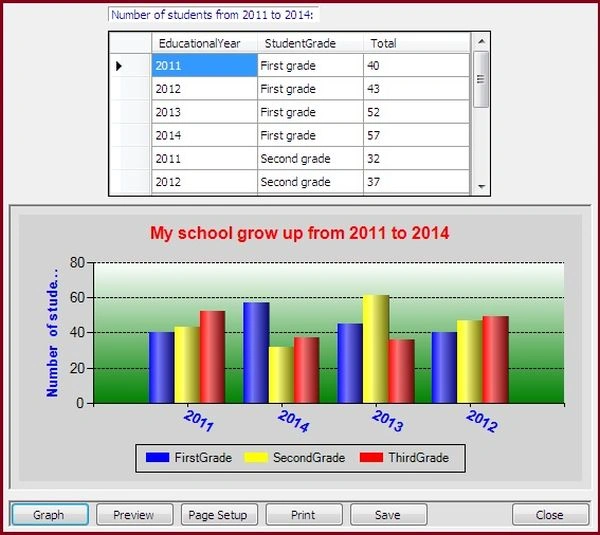
- frmGraph2: Using the DataBindXY method the same as the previous form but by binding the chart to data from a MDB file.
- frmGraph3: Using the DataBindTable method by binding the chart to data from a MDB file.
- frmGraph4: Using the AddXY method by binding the chart to data from a MDB file.
- frmGraph5: Using the DataSource and binding the chart to data from a MDB file with the DataBind method.
About the Code
I begin the code in all the forms with the following procedure:
- Private Sub LoadSchoolData()
- 'Following lines to connect with access database file 'MySchool.mdb':
- MyDataFile = Application.StartupPath & "\DataFile\MySchool.mdb"
- strConnection = "provider=microsoft.jet.oledb.4.0;data source=" _
- & MyDataFile & ";" & "Jet OLEDB:Database Password=" & MyPass & ";"
- Try
- 'Define database query:
- strSql = "SELECT EducationalYear, StudentGrade, COUNT(*) AS Total FROM StudentData " _
- & "GROUP BY EducationalYear, StudentGrade " _
- & "ORDER BY EducationalYear; "
- 'Define Data Adapter:
- Dim datAdp As OleDbDataAdapter = New OleDbDataAdapter(strSql, strConnection)
- tblStudents = New DataTable
- datAdp.Fill(tblStudents)
- 'Set DataSource of DataGrid:
- GridSchool.DataSource = tblStudents
- lblSample.Text = "Number of students from 2011 to 2014:"
- Catch ex As Exception
- MessageBox.Show(ex.ToString())
- End Try
- End Sub
But the statement "strSql" varies from one form to another.
Any form has a procedure to create the "ChartArea", "Series", "Legend" and "Title" of the chart.
The following procedure creates a ChartArea in the form "frmGraph1":
- Private Sub CreateChartArea()
- 'Clear ChartAreas if found:
- MyChart.ChartAreas.Clear()
- 'Create new ChartArea
- MyChartArea = New ChartArea()
- 'Add ChartArea:
- MyChart.ChartAreas.Add("MyChartArea")
- 'Set BackColor to Chart and Graph area:
- MyChart.BackColor = Color.LightGray
- MyChart.ChartAreas("MyChartArea").BackSecondaryColor = Color.Green
- MyChart.ChartAreas("MyChartArea").BackGradientStyle = GradientStyle.TopBottom
- 'Hide vertical lines:
- MyChart.ChartAreas("MyChartArea").AxisX.MajorGrid.Enabled = False
- 'Set horizontal lines to Dash style:
- MyChart.ChartAreas("MyChartArea").AxisY.MajorGrid.LineDashStyle = ChartDashStyle.Dash
- 'Set X-Axis to four Series:
- MyChart.ChartAreas("MyChartArea").AxisX.Maximum = 5
- 'Remove default Labels from X-Axis:
- MyChart.ChartAreas("MyChartArea").AxisX.LabelStyle.IsEndLabelVisible = False
- 'Display X-Axis labels with 30 degree:
- MyChart.ChartAreas("MyChartArea").AxisX.LabelStyle.Angle = 30
- 'Set X-Axis labels font:
- MyChart.ChartAreas("MyChartArea").AxisX.LabelStyle.Font = New Font("Arial", 10, FontStyle.Bold)
- 'Set X-Axis labels color to blue:
- MyChart.ChartAreas("MyChartArea").AxisX.LabelStyle.ForeColor = Color.Blue
- 'Set Y-Axis title:
- MyChart.ChartAreas("MyChartArea").AxisY.Title = "Number of students"
- 'Set Y-Axis title font:
- MyChart.ChartAreas("MyChartArea").AxisY.TitleFont = New Font("Arial", 10, FontStyle.Bold)
- 'Set Y-Axis title color:
- MyChart.ChartAreas("MyChartArea").AxisY.TitleForeColor = Color.Blue
- 'You can use ChartAreas index instead ChartAreas name:
- 'Example: MyChart.ChartAreas(0).BackColor = Color.Lavender
- End Sub
The following procedure draws the chart in the form "frmGraph4".
- Private Sub DrawGraph() 'Binding to Data with (AddXY) methods:
- 'Dim RowNum As DataRow
- For Each RowNum As DataRow In tblStudents.Rows
- 'Add a new series
- Dim SeriesName As String = RowNum("StudentGrade").ToString()
- MyChart.Series.Add(SeriesName)
- 'Set Graph Type as Column:
- MyChart.Series(SeriesName).ChartType = SeriesChartType.Column
- 'Set Graph shape as Cylinder:
- MyChart.Series(SeriesName)("DrawingStyle") = "Cylinder"
- 'Add Y value
- For COlNum As Integer = 1 To (tblStudents.Columns.Count) - 1
- Dim ColName As String = tblStudents.Columns(COlNum).ColumnName
- Dim YValue As Integer = Convert.ToInt32(RowNum(ColName))
- MyChart.Series(SeriesName).Points.AddXY(ColName, YValue)
- Next COlNum
- Next RowNum
- 'Set Graph color to Series
- MyChart.Series(0).Color = Color.Blue
- MyChart.Series(1).Color = Color.Yellow
- MyChart.Series(2).Color = Color.Red
- End Sub
It is desirable to beautify your data with charts, so I invite you to go to the source file to read the code because I cannot list all the source code for the limited space available. If you have any idea about this code, please tell me. Thanks for the C# Corner team and thanks for all.
Antoni ArtigasPosted Jul 17, 2019, 10:51 AM
Hi Mostafa, I can't found the link to download your examples/code. Thank's for share..