
Overview of Google Charts
Google Chart tools are powerful, simple to use, and free. They have many features namely:
- Rich Gallery- A variety of charts, we can choose the best fit for our data.
- Customizable- We can make our own charts and configure with different set of features.
- Cross browser compatibility- Can be used across various Browsers.
- Dynamic Data- Connects a variety of data connection tools and protocols.
Basic Library Loading
- <script type="text/javascript" src="https://www.gstatic.com/charts/loader.js"></script>
- <script type="text/javascript">
- google.charts.load('current', {
- packages: ['corechart']
- });
- google.charts.setOnLoadCallback(drawChart);...
- </script>
- The first line loads the loader file itself. Once it is loaded, we can use how many charts we want.
- The first argument in google.charts.load is the version number, which we are using, ‘’current’,’ which indicates to take the latest official release of Google Charts to be loaded, second argument is the packages of charts to be loaded ,”corechart” includes all the basic charts like Pie Chart, Bar Chart, Area Chart etc.
- After the charts have been loaded successfully, we are calling a function called drawchart, which is a callback function after loading.
Basic Chart Implementation in HTML page
The code given below generates Pie Chart.
- <html>
- <head>
- <!--Load the AJAX API-->
- <script type="text/javascript" src="https://www.gstatic.com/charts/loader.js"></script>
- <script type="text/javascript">
- // Load the Visualization API and the piechart package.
- google.charts.load('current', {
- packages: ['corechart']
- });
- // Set a callback to run when the Google Visualization API is loaded.
- google.charts.setOnLoadCallback(drawChart);
- // Callback that creates and populates a data table,
- // instantiates the pie chart, passes in the data and
- // draws it.
- function drawChart() {
- // Create the data table.
- var data = new google.visualization.DataTable();
- data.addColumn('string', 'Topping');
- data.addColumn('number', 'Slices');
- data.addRows(4);
- data.setCell(0, 0, "mashroom");
- data.setCell(0, 1, 4);
- data.setCell(1, 0, "Cheese");
- data.setCell(1, 1, 3);
- data.setCell(2, 0, "Mixedveg");
- data.setCell(2, 1, 2);
- data.setCell(3, 0, "Merghartia");
- data.setCell(3, 1, 1);
- // Set chart options
- var options = {
- 'title': 'How Much Pizza I Ate Last Night',
- 'width': 400,
- 'height': 300
- };
- // Instantiate and draw our chart, passing in some options.
- var chart = new google.visualization.PieChart(document.getElementById('chart_div'));
- chart.draw(data, options);
- }
- </script>
- </head>
- <body> //Div that will hold the pie chart
- <div id="chart_div" style="width:400; height:300"></div>
- </body>
- </html>
To set the data, we are using google.visualization.datatable, which stores the data in tabular structure and in the example given above for each of the cells, we are setting the value after which we are providing the title, width and height of the chart to displayed
Finally, creating the instance of google.visualization.piechart by passing an appropriate div element, which holds the Pie Chart, calling chart.draw() function will generate the chart.

Preparation of SharePoint data for Google Charts
In order to implement the Google Chart in SharePoint we must first create a data source which can used to generate the chart and can be dynamic too. To create a data source we can create a custom list with two columns of type strings and numbers respectively. String type column is to hold labels for pie chart and number type is for the value for each of the labels.
To fetch the data from SharePoint list, JavaScript object model can be used and the code given below demonstrates the fetching of data from the custom list and pushing the values in to two arrays, one which holds labels for the chart and other the values (tasks array is holding the labels, hours array is holding the values).
- var hours = [];
- var tasks = [];
- SP.SOD.executeFunc('sp.js', 'SP.ClientContext', Test);
- function Test() {
- var clientcontext = new SP.ClientContext();
- var web = clientcontext.get_web();
- var list = web.get_lists().getByTitle('ChartList'); //replace this with your list name //
- listitems = list.getItems(SP.CamlQuery.createAllItemsQuery());
- clientcontext.load(listitems);
- clientcontext.executeQueryAsync(success, failure);
- }
- function success() {
- var listitemenumerator = listitems.getEnumerator();
- while (listitemenumerator.moveNext()) {
- var item = listitemenumerator.get_current().get_item('Title'); // replace with your column name//
- tasks.push(item);
- var itemvalue = listitemenumerator.get_current().get_item('Duration'); // replace with your column name//
- hours.push(itemvalue);
- }
- }
- function failure() {
- alert("request failed" + args.get_message());
- }
It is a straightforward implementation to fetch the list items from the list. We are saving this JavaScript file and uploading it to site assets library from which we can refer this file to the main HTML file.
Main HTML
- <html>
- <head>
- <meta http-equiv='cache-control' content='no-cache'>
- <meta http-equiv='expires' content='0'>
- <meta http-equiv='pragma' content='no-cache'>
- <script src="test.js"></script>
- <!—replace with your path where js file is located in sharepoint!>
- <script src="https://ajax.aspnetcdn.com/ajax/jQuery/jquery-3.1.1.min.js"></script>
- <script type="text/javascript" src="https://www.gstatic.com/charts/loader.js"></script>
- <script type="text/javascript">
- $(document).ready(function() {
- google.charts.load('current', {
- 'packages': ['corechart']
- });
- google.charts.setOnLoadCallback(drawChart);
- });
- function drawChart() {
- var data = new google.visualization.DataTable();
- data.addColumn('string', 'Task');
- data.addColumn('number', 'Hours Per Day');
- if (hours.length > 1) {
- data.addRows(hours.length);
- for (var i = 0; i <= hours.length - 1; i++) {
- data.setCell(i, 0, tasks[i]);
- data.setCell(i, 1, hours[i]);
- }
- }
- var options = {
- title: 'My Daily Activities'
- };
- var chart = new google.visualization.PieChart(document.getElementById('piechart'));
- chart.draw(data, options);
- }
- </script>
- </head>
- <body>
- <div id="piechart" style="width: 900px; height: 500px"></div>
- </body>
- </html>
Here in JavaScript code given above, we are setting the data, which we obtained from the referenced JavaScript file.
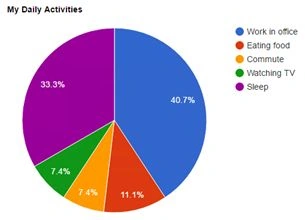
The code given above is used in content editor Web part to generate the Pie Chart and the final result would be as shown below.
Pie Chart shows casing my daily activities
Humayun Kabir MamunPosted Jan 15, 2017, 1:20 AM
Thanks for this nice article...