

Introduction
This article is about integrating or using Charts in Angular 5 with many options such as Column Chart, Pie Chart, Line Chart, Bar Chart, Area Chart, and Combined Charts. We are going to see how to integrate charts with Angular 5 App within a few steps.
As we know, visual representation of any data is worth thousands of lines written as a text, and also it will be time-consuming to make judgments after reading sophisticated data. Charts are Visual Representation Tools that make things easy to understand in an easy manner.
This article is about integrating or using Charts in Angular 5 with many options such as Column Chart, Pie Chart, Line Chart, Bar Chart, Area Chart, and Combined Charts. We are going to see how to integrate charts with Angular 5 App within a few steps.
As we know, visual representation of any data is worth thousands of lines written as a text, and also it will be time-consuming to make judgments after reading sophisticated data. Charts are Visual Representation Tools that make things easy to understand in an easy manner.
Let's start with the implementation of different charts with Angular.
In this series, I am going to cover 7 types of different charts used with dummy data.
- Column Chart
- Bar Chart
- Pie Chart
- Line Chart
- Bubble Chart
- Doughnut Chart
- Combined Chart
For that, I am using a very lightweight extension, FusionCharts which are easy to implement and effective for the Angular environment.
Let's implement all charts one by one.
Step 1 Installation
To use FusionChart, we should include it via the following command using Angular CLI.
- npm install angular4-fusioncharts --save
After completion of the installation, you should import it in the module.ts file as below.

Also, in this app, I'm using some of the Angular Material Components like,
- MatToolbar
- MatButton
- MatMenu
- MatCard
To install Angular Material Components, refer to the following command,
- npm install --save @angular/material @angular/cdk @angular/animations
I have pasted the complete module.ts file code below.
- import { BrowserModule } from '@angular/platform-browser';
- import { NgModule } from '@angular/core';
- // To use Material Component
- import { MatCardModule, MatToolbarModule, MatToolbar, MatButtonModule, MatButton, MatMenuModule } from '@angular/material';
- import { AppComponent } from './app.component';
- // To use Animations
- import { BrowserAnimationsModule } from '@angular/platform-browser/animations';
- // For Routing Purpose
- import { routing } from './routes';
- // For FusionChart
- import * as FusionCharts from 'fusioncharts';
- import * as Charts from 'fusioncharts/fusioncharts.charts';
- import * as FintTheme from 'fusioncharts/themes/fusioncharts.theme.fint';
- import { FusionChartsModule } from 'angular4-fusioncharts';
- FusionChartsModule.fcRoot(FusionCharts, Charts, FintTheme);
- @NgModule({
- declarations: [
- AppComponent,
- ],
- imports: [
- routing,
- BrowserModule,
- MatCardModule,
- MatToolbarModule,
- MatButtonModule,
- MatMenuModule,
- FusionChartsModule,
- BrowserAnimationsModule
- ],
- exports: [
- BrowserModule,
- MatCardModule,
- MatToolbarModule,
- MatButtonModule,
- MatMenuModule
- ],
- providers: [
- ],
- bootstrap: [AppComponent]
- })
- export class AppModule { }
Step 2 [ Routing ]
As of now, I am also implementing Routing in my app.
For that, you should create a separate file named routes.ts [For batter practice, I would suggest this way]
routes.ts
- import { ModuleWithProviders } from '@angular/core';
- import { Routes, RouterModule } from '@angular/router';
- import { BarChartComponent } from './bar-chart/bar-chart.component';
- import { BubbleChartComponent } from './bubble-chart/bubble-chart.component';
- import { ColumnChartComponent } from './column-chart/column-chart.component';
- import { DoughuntChartComponent } from './doughunt-chart/doughunt-chart.component';
- import { LineChartComponent } from './line-chart/line-chart.component';
- import { PieChartComponent } from './pie-chart/pie-chart.component';
- import { SplineChartComponent } from './spline-chart/spline-chart.component';
- const appRoutes: Routes = [
- // Default Page
- { path: '', redirectTo:'Bar',pathMatch:'full' },
- { path: 'Bar', component: BarChartComponent },
- { path: 'Pie', component: PieChartComponent },
- { path: 'Column', component: ColumnChartComponent },
- { path: 'Line', component: LineChartComponent },
- { path: 'Doughunt', component: DoughuntChartComponent },
- { path: 'Bubble', component: BubbleChartComponent },
- { path: 'Mixed', component: SplineChartComponent }
- ];
- export const routing: ModuleWithProviders = RouterModule.forRoot(appRoutes);
So, we are done with basic configuration for FusionChart, Material Component, and Routing.
Step 3
Now, we are going to configure our routing and the main page of our app.
app.component.html
- <mat-toolbar color="accent">
- <span>Manav Pandya - C#Corner</span>
- <span class="demo-toolbar"></span>
- <button mat-button href="www.asp-dotnet-mvc-tutorials.blogspot.in">Go To My Blog</button>
- <button mat-button [matMenuTriggerFor]="menu">Select Charts From Below Menu</button>
- <mat-menu #menu="matMenu">
- <button [routerLink]="['/Bar']" mat-menu-item>Bar Chart</button>
- <button [routerLink]="['/Pie']" mat-menu-item>Pie Chart</button>
- <button [routerLink]="['/Column']" mat-menu-item>Column Chart</button>
- <button [routerLink]="['/Line']" mat-menu-item>Line Chart</button>
- <button [routerLink]="['/Doughunt']" mat-menu-item>DougHunt Chart</button>
- <button [routerLink]="['/Bubble']" mat-menu-item>Bubble Chart</button>
- <button [routerLink]="['/Mixed']" mat-menu-item>Mixed Chart</button>
- </mat-menu>
- </mat-toolbar>
- <div>
- <router-outlet></router-outlet>
- </div>
- <mat-toolbar> : contains toolbar of material component
- <mat-menu> : side menu with many options given to them
- [routerLink] : routerLink meant to be link with their defined routes
- <router-outlet> : It is placeholder by which routes load their content
Step 4
Now, we are going to start our FusionChart implementation.
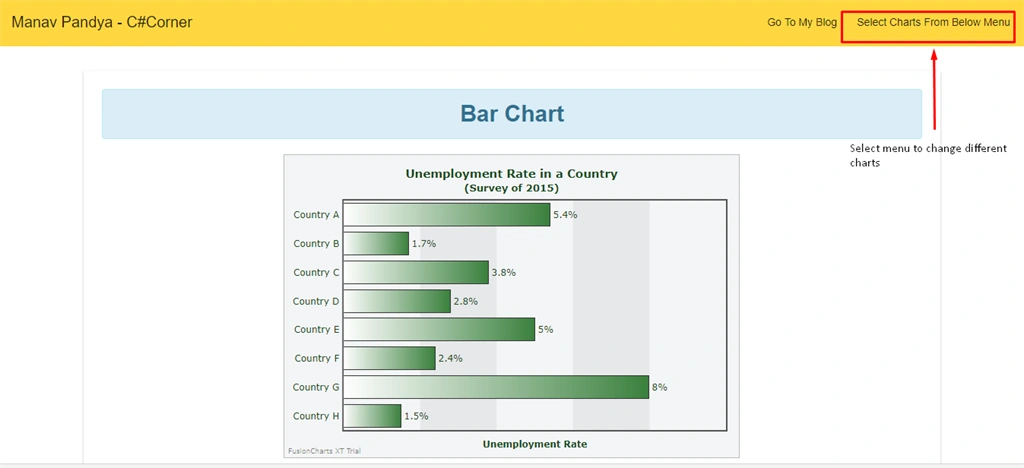
Bar Chart
I have created separate components for bar chart implementation, do as follows.
- ng g c bar-chart
- // Hold Content of an chart
- <mat-card>
- <div class="alert alert-info">
- <strong>Bar Chart</strong>
- </div>
- <fusioncharts [id]="id" [width]="width" [height]="height" [type]="type" [dataFormat]="dataFormat" [dataSource]="dataSource"></fusioncharts>
- </mat-card>
- id = 'AngularChart1';
- width = 600;
- height = 400;
- type = 'bar2d';
- dataFormat = 'json';
- dataSource;
- constructor()
- {
- this.dataSource = {
- "chart": {
- "caption": "Unemployment Rate in a Country",
- "subcaption": "(Survey of 2015)",
- "yaxisname": "Unemployment Rate",
- "numbersuffix": "%",
- "basefontsize": "12",
- "basefontcolor": "#194920",
- "valuefontcolor": "#194920",
- "canvasBgColor": "#f3f5f6",
- "canvasBgAlpha": "100",
- "bgColor": "#f3f5f6",
- "BgAlpha": "100",
- "palettecolors": "#3A803D",
- "plottooltext": "$label Rate of Unemployment : $datavalue",
- "theme": "zune"
- },
- "data": [
- {
- "label": "Country A",
- "value": "5.4"
- },
- {
- "label": "Country B",
- "value": "1.7"
- },
- {
- "label": "Country C",
- "value": "3.8"
- },
- {
- "label": "Country D",
- "value": "2.8"
- },
- {
- "label": "Country E",
- "value": "5.0"
- },
- {
- "label": "Country F",
- "value": "2.4"
- },
- {
- "label": "Country G",
- "value": "8.0"
- },
- {
- "label": "Country H",
- "value": "1.5"
- }
- ]
- }
- }
Some of the important options are like,
- Height , Width , Type = bar2d // Defines that it is bar chart
And, this.dataSource is used to render the dummy data for Bar Chart that you can find in the HTML portion of that.

That's it. We have created all necessary files; now, it's time to run our app by using ng serve.
Pie Chart
To implement a Pie Chart, create a new component.
- ng g c pie-chart
- <mat-card>
- <div class="alert alert-info">
- <strong>Pie Chart</strong>
- </div>
- <fusioncharts [id]="id" [width]="width" [height]="height" [type]="type" [dataFormat]="dataFormat" [dataSource]="dataSource"></fusioncharts>
- </mat-card>
- id = 'AngularChart2';
- width = 600;
- height = 400;
- type = 'pie3d';
- dataFormat = 'json';
- dataSource;
- constructor() {
- this.dataSource = {
- "chart": {
- "caption": "Electronics Selling",
- "subCaption": "Top 5 stores in last month by revenue",
- "numberprefix": "Rs.(Crore) ",
- "theme": "fint"
- },
- "data": [{
- "label": "Redmi",
- "value": "95"
- },
- {
- "label": "IPhone",
- "value": "90"
- },
- {
- "label": "Motorola",
- "value": "76"
- },
- {
- "label": "Samsung",
- "value": "67"
- },
- {
- "label": "vivo",
- "value": "55"
- }
- ]
- }
- }
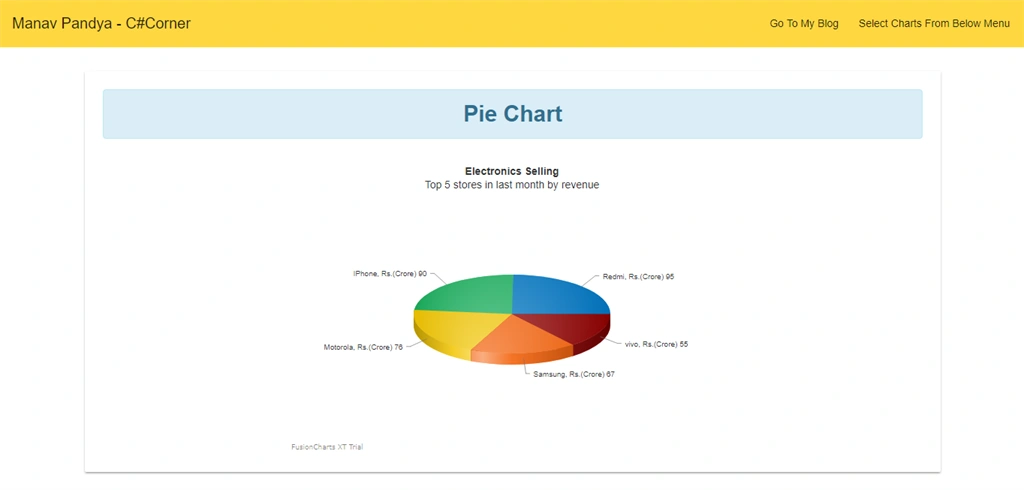
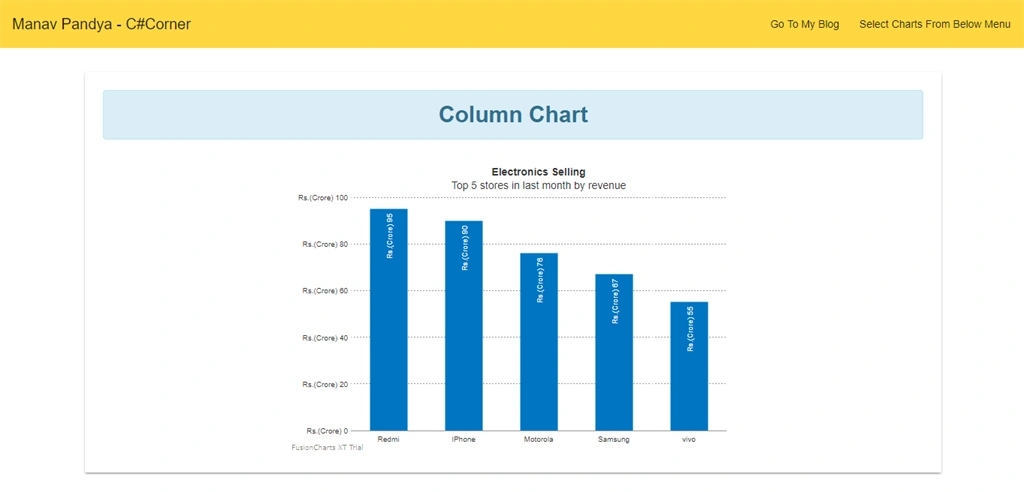
Column Chart
Column chart is the most commonly used type of charts that shows bars with appropriate data. Just create a new component.
- ng g c column-chart
- <mat-card>
- <div class="alert alert-info">
- <strong>Column Chart</strong>
- </div>
- <fusioncharts [id]="id" [width]="width" [height]="height" [type]="type" [dataFormat]="dataFormat" [dataSource]="dataSource"></fusioncharts>
- </mat-card>
- id = 'AngularChart3';
- width = 600;
- height = 400;
- type = 'column2d';
- dataFormat = 'json';
- dataSource;
- constructor() {
- this.dataSource = {
- "chart": {
- "caption": "Electronics Selling",
- "subCaption": "Top 5 stores in last month by revenue",
- "numberprefix": "Rs.(Crore) ",
- "theme": "fint"
- },
- "data": [{
- "label": "Redmi",
- "value": "95"
- },
- {
- "label": "IPhone",
- "value": "90"
- },
- {
- "label": "Motorola",
- "value": "76"
- },
- {
- "label": "Samsung",
- "value": "67"
- },
- {
- "label": "vivo",
- "value": "55"
- }
- ]
- }
- }
- type = 'column2d' // For 2 Dimentional presentation
- dataformat = 'json'
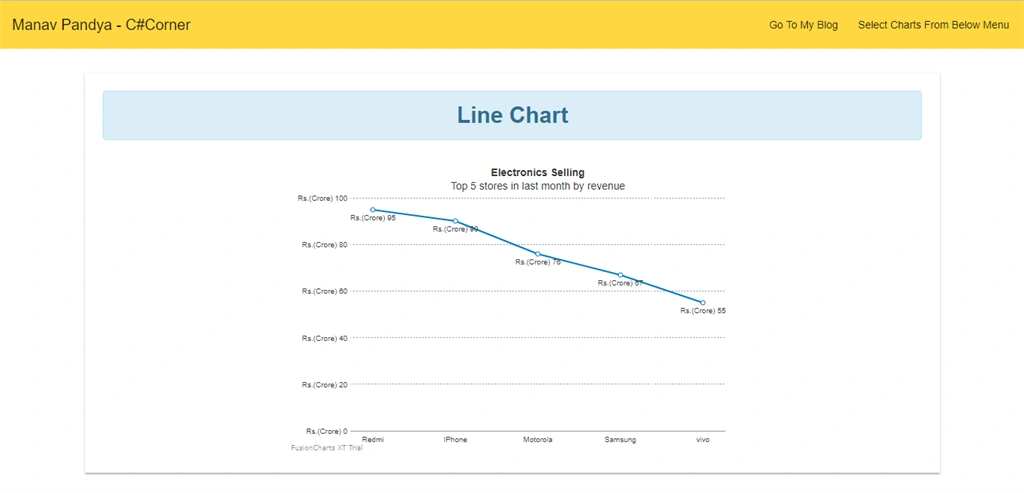
Line Chart
Line chart represents the growth of data through a line with its label values. Again, create a new component.
- ng g c line-chart
- <mat-card>
- <div class="alert alert-info">
- <strong>Line Chart</strong>
- </div>
- <fusioncharts [id]="id" [width]="width" [height]="height" [type]="type" [dataFormat]="dataFormat" [dataSource]="dataSource"></fusioncharts>
- </mat-card>
- id = 'AngularChart4';
- width = 600;
- height = 400;
- type = 'line';
- dataFormat = 'json';
- dataSource;
- constructor() {
- this.dataSource = {
- "chart": {
- "caption": "Electronics Selling",
- "subCaption": "Top 5 stores in last month by revenue",
- "numberprefix": "Rs.(Crore) ",
- "theme": "fint"
- },
- "data": [{
- "label": "Redmi",
- "value": "95"
- },
- {
- "label": "IPhone",
- "value": "90"
- },
- {
- "label": "Motorola",
- "value": "76"
- },
- {
- "label": "Samsung",
- "value": "67"
- },
- {
- "label": "vivo",
- "value": "55"
- }
- ]
- }
- }
Conclusion
In this post, we have seen 4 types of Fusion Charts with their different options -
- Bar Chart
- Pie Chart
- Column Chart
- Line Chart
I have tried everything possible. If I missed anything, please let me know via comments or message.
Hope you have learned something. Stay tuned for Part 2!
Chittaranjan SwainPosted Nov 27, 2019, 9:15 PM
Very useful article.
Abhijit PandiaPosted Jan 18, 2019, 6:54 AM
I am facing errors: Cannot read property 'addDep' of undefined at Object.11
Abhijit PandiaPosted Jan 18, 2019, 6:54 AM
Uncaught TypeError: Cannot read property 'addDep' of undefined at Object.11 (fusioncharts.theme.fint.js:1) at __webpack_require__ (fusioncharts.theme.fint.js:1) at eval (fusioncharts.theme.fint.js:1) at eval (fusioncharts.theme.fint.js:1) at eval (fusioncharts.service.js:26) at Array.forEach (<anonymous>) at Function.FusionChartsService.resolveFusionChartsCore (fusioncharts.service.js:25) at Function.FusionChartsModule.fcRoot (fusioncharts.module.js:33) at eval (app.module.ts:19) at Object.../../../../../src/app/app.module.ts (main.bundle.js:36) 11 @ fusioncharts.theme.fint.js:1 __webpack_require__ @ fusioncharts.theme.fint.js:1 (anonymous) @ fusioncharts.theme.fint.js:1 (anonymous) @ fusioncharts.theme.fint.js:1 (anonymous) @ fusioncharts.service.js:26 FusionChartsService.resolveFusionChartsCore @ fusioncharts.service.js:25 FusionChartsModule.fcRoot @ fusioncharts.module.js:33 (anonymous) @ app.module.ts:19 ../../../../../src/app/app.module.ts @ main.bundle.js:36 __webpack_require__ @ inline.bundle.js:55 (anonymous) @ main.ts:1 ../../../../../src/main.ts @ main.bundle.js:214 __webpack_require__ @ inline.bundle.js:55 0 @ main.bundle.js:229 __webpack_require__ @ inline.bundle.js:55 webpackJsonpCallback @ inline.bundle.js:26 (anonymous) @ main.bundle.js:1 zone.js:199 Uncaught SyntaxError: #25081840 FusionCharts Error >> Use the "new" keyword while creating a new FusionCharts object at h (fusioncharts.js:13) at Function.FusionChartsService.resolveFusionChartsCore (fusioncharts.service.js:23) at Function.FusionChartsModule.fcRoot (fusioncharts.module.js:33) at eval (app.module.ts:19) at Object.../../../../../src/app/app.module.ts (main.bundle.js:36) at __webpack_require__ (inline.bundle.js:55) at eval (main.ts:1) at Object.../../../../../src/main.ts (main.bundle.js:214) at __webpack_require__ (inline.bundle.js:55) at Object.0 (main.bundle.js:229) h @ fusioncharts.js:13 FusionChartsService.resolveFusionChartsCore @ fusioncharts.service.js:23 FusionChartsModule.fcRoot @ fusioncharts.module.js:33 (anonymous) @ app.module.ts:19 ../../../../../src/app/app.module.ts @ main.bundle.js:36 __webpack_require__ @ inline.bundle.js:55 (anonymous) @ main.ts:1 ../../../../../src/main.ts @ main.bundle.js:214 __webpack_require__ @ inline.bundle.js:55 0 @ main.bundle.js:229 __webpack_require__ @ inline.bundle.js:55 webpackJsonpCallback @ inline.bundle.js:26 (anonymous) @ main.bundle.js:1 setTimeout (async) scheduleTask @ zone.js:2302 ZoneDelegate.scheduleTask @ zone.js:410 Zone.scheduleTask @ zone.js:238 Zone.scheduleMacroTask @ zone.js:261 scheduleMacroTaskWithCurrentZone @ zone.js:1245 (anonymous) @ zone.js:2317 proto.(anonymous function) @ zone.js:1569 m @ fusioncharts.js:13 v @ fusioncharts.js:13 h @ fusioncharts.js:13 FusionChartsService.resolveFusionChartsCore @ fusioncharts.service.js:23 FusionChartsModule.fcRoot @ fusioncharts.module.js:33 (anonymous) @ app.module.ts:19 ../../../../../src/app/app.module.ts @ main.bundle.js:36 __webpack_require__ @ inline.bundle.js:55 (anonymous) @ main.ts:1 ../../../../../src/main.ts @ main.bundle.js:214 __webpack_require__ @ inline.bundle.js:55 0 @ main.bundle.js:229 __webpack_require__ @ inline.bundle.js:55 webpackJsonpCallback @ inline.bundle.js:26 (anonymous) @ main.bundle.js:1
Abhijit PandiaPosted Jan 18, 2019, 6:53 AM
Hello sir please share the github repo for the project in my email id:[email protected]
Sainath GhanatePosted May 25, 2018, 4:34 AM
Hi Manav, I saw the previous comments, the above code does not work in angular 5. So can you share the charts which support angular 5.
nav aPosted May 24, 2018, 7:37 AM
It doesnt work with angular 5.2 .import * as FusionCharts from 'fusioncharts'; import * as Charts from 'fusioncharts/fusioncharts.charts'; import * as FintTheme from 'fusioncharts/themes/fusioncharts.theme.fint'; import { FusionChartsModule } from 'angular4-fusioncharts'; FusionChartsModule.fcRoot(FusionCharts, Charts, FintTheme); this one is not detatede except this import { FusionChartsModule } from 'angular4-fusioncharts';
Ángel MartinPosted May 10, 2018, 12:28 PM
I have a problem when I try to import the modules (FusionCharts, Charts, and FintTheme), it says me that it can't find the modules. What can it happen?
Pramod kumarPosted May 8, 2018, 10:30 PM
Hello Manav Sir,Could you please share the source code with me,Email id:[email protected]
Rama KrishnaPosted Apr 28, 2018, 5:29 AM
Manav, thats a very good article, can you also share the app if possible.
Manav PandyaPosted Feb 22, 2018, 2:15 AM
Thanks for comment Satish Kumar Vadlavalli .......
Satish Kumar VadlavalliPosted Feb 22, 2018, 1:59 AM
Awesome yaar.Very nicee...
Saravanakumar SekaranPosted Feb 14, 2018, 1:42 AM
Wow simply awesomeeeeee!!!!
Sagar Pandurang KapPosted Feb 4, 2018, 10:53 PM
Awesome yaar.Very nicee...
Sanwar RanwaPosted Feb 2, 2018, 7:25 AM
GOOD ARTICLE HELPFULL....
Manav PandyaPosted Feb 2, 2018, 3:26 AM
Thanks bro Gajendra Jangid ........
Gajendra JangidPosted Feb 2, 2018, 3:15 AM
Great article...dear.......well done ....keep it up........
Manav PandyaPosted Feb 2, 2018, 2:35 AM
Thanks for your valuable comment Hamid Khan
Hamid KhanPosted Feb 2, 2018, 2:31 AM
Very great artilce............ Article of the day..........
Manav PandyaPosted Feb 2, 2018, 1:42 AM
Hope you liked it Sir Hiten Pandya .....
Hiten PandyaPosted Feb 2, 2018, 1:41 AM
Good one bro... Superb writing
Manav PandyaPosted Feb 1, 2018, 11:48 PM
Thanks Bro @Dharmraj ........
Dharmraj ThakurPosted Feb 1, 2018, 11:46 PM
Well done manav.... well writeup
Manav PandyaPosted Feb 1, 2018, 11:31 PM
Soon i will attach source code
Pramod kumarPosted Feb 1, 2018, 11:27 PM
Hello Sir,Please provide me the download link and mail me at my mail id :[email protected]
Manav PandyaPosted Feb 1, 2018, 10:21 PM
Thanks sir Naresh Singhal .......
Naresh SinghalPosted Feb 1, 2018, 10:19 PM
Very well explained.....keep in on.....
Manav PandyaPosted Feb 1, 2018, 10:11 PM
Hope you liked it Rahul Saraswat ...
RahulPosted Feb 1, 2018, 9:35 PM
Nice explanation bro, keep it up :)