

Introduction
Tableau is an interactive data visualization tool that can be used to create customized dashboards and generate compelling business insights. It can help anyone see and understand their data. It empowers the users with features like the ability to connect to almost any database, drag and drop to create visualizations, and share with a click.
Today, let us learn how we can integrate Tableau with SharePoint as a data source. We will also see how Tableau reports can be embedded in a SharePoint page.
Create SharePoint List
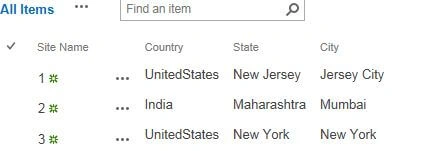
Let's create a custom list with the below column names as text type.
You may populate some sample valid data.
Setting up Tableau
You can download Tableau here. It comes with a 14-day trial.
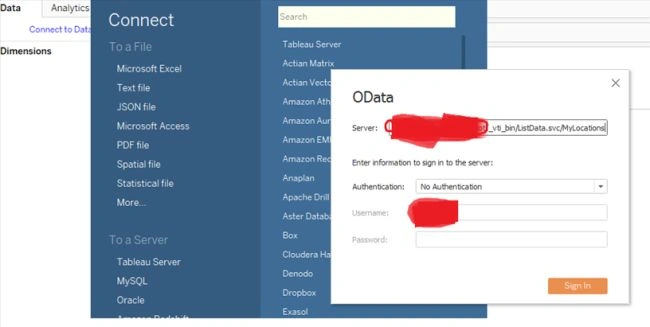
Let's connect the SharePoint list using OData with Tableau.
This is how you will form the URL.
<yoursiteurl>/_vti_bin/ListData.svc/<List Name>
Please choose authentication accordingly. It gives two options - no authentication or embed user id and password.
Once done, the SharePoint list will be loaded as a data source. This data source can be used to generate various insights on data.
Tableau generates a request using OData protocol which is then processed by SharePoint.
SharePoint generates the output in the form of JSON or ATOM, which is then parsed by Tableau.
Creating Tableau Reports
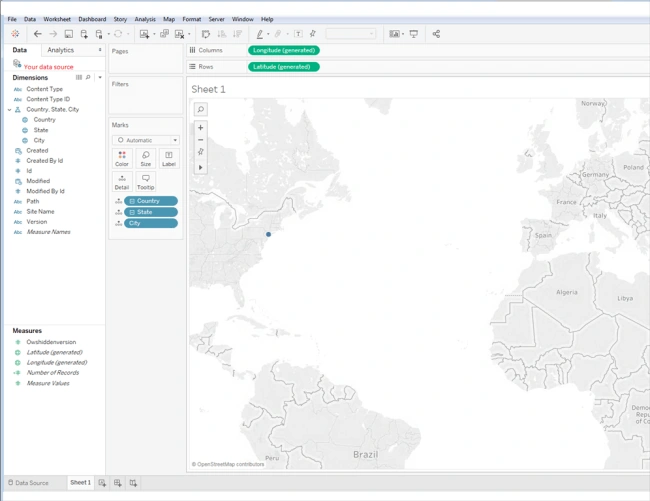
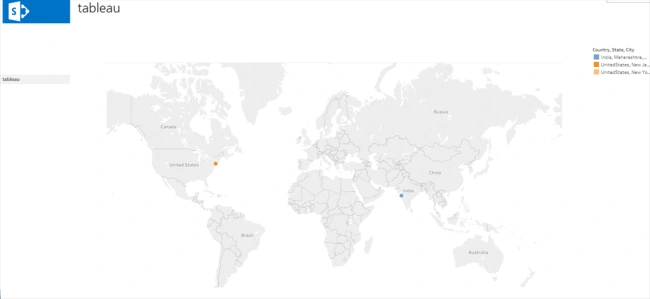
In this example, we will use the data to generate dynamic and interactive maps.
Drag Country, State, and City under Marks and Tableau will generate the latitude and longitude accordingly.
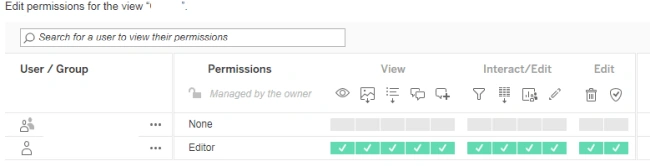
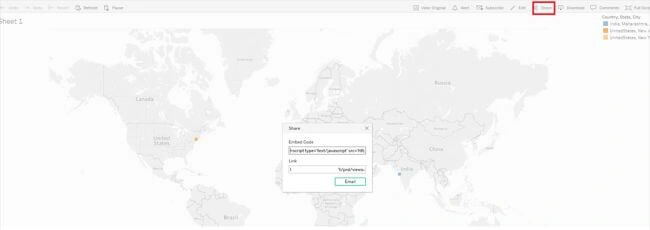
Fields can also be dragged to Filters to enable filtering. Go to Server on the top menu and publish your workbook on Tableau server.
Join the conversation! Your thoughts help the community grow.