

In this blog, we see how to integrate the Power BI Report with the Canvas App. Microsoft has recently provided an integration of the Power BI report within the Canvas app, as the report will be handy for users working on Mobile apps.
Let’s consider a scenario where we need to show a complete sales report within the Canvas app.
We will need to follow the steps below to achieve this requirement.
Integration Power BI Report with Canvas App
Step 1
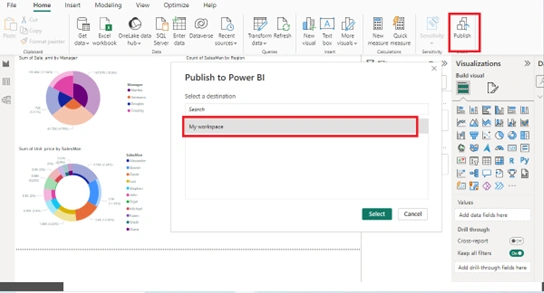
Navigate to Power BI Desktop and Publish our report on your My Workspace, as shown in the below screen.
Step 2
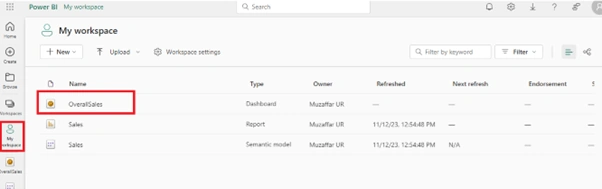
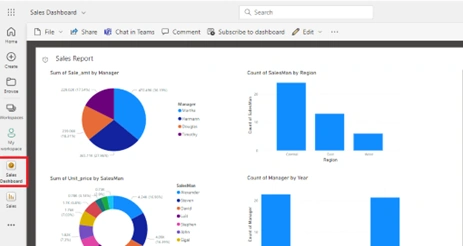
Navigate to the Power BI Service at https://app.powerbi.com and make sure you have the Power BI Dashboard added to the Power BI workspace.
Below is a screenshot of the same.
Step 3
Now, let’s develop a Canvas app to embed this Power BI Report.
Navigate to https://make.powerapps.com and, within the appropriate environment, create a Canvas app and create a new screen to show Power BI Report as shown in below screens.
Step 4
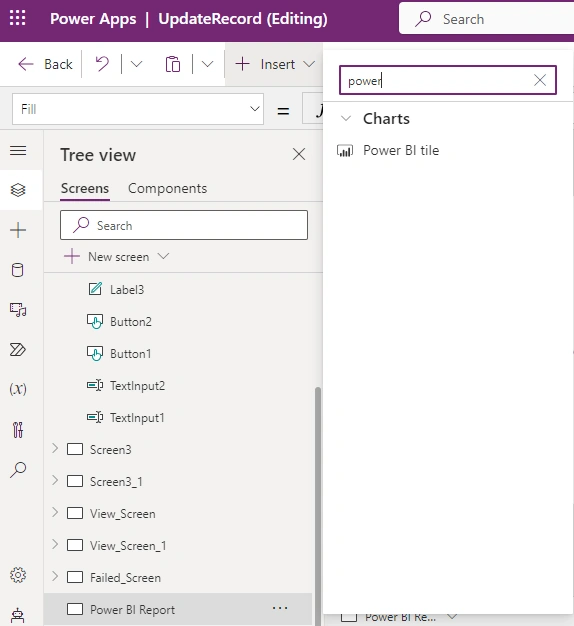
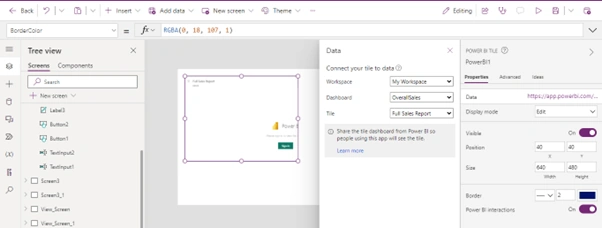
Insert Power BI Tile on the screen as shown in the below screenshot
Step 5
Now, let’s choose the below setting to enable Power BI Report.
- Workspace: We need to select the Power BI Workspace that we have created. In our case, we have selected M Workspace.
- Dashboard: Select the Power BI Dashboard. In this case, we need to select Overall Sales
- Title: Select the Report to be displayed on the Canvas App. Select the title we have created Full Sales Report.
Please refer to the screenshot below.
Step 6
Save the app and publish the changes.
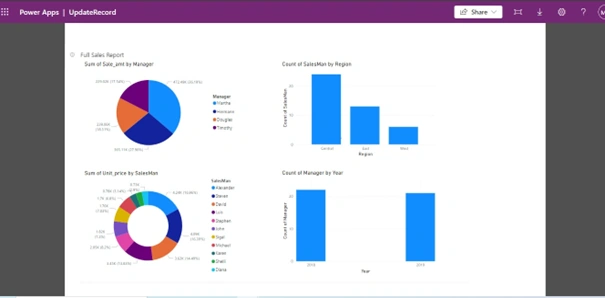
Finally, view the Power BI report in the Canvas app.
Thank you.
Join the conversation! Your thoughts help the community grow.