

Introduction
Line charts are powerful visualizations used to represent data trends over time or continuous categories. In Power Apps, line charts offer a compelling way to visualize data from SharePoint lists, enabling users to identify patterns, trends, and outliers efficiently. This article provides a comprehensive guide on creating line charts in Power Apps using SharePoint list data, highlighting their benefits, features, and limitations.
Benefits of line charts in Power Apps
- Visual representation: Line charts offer a clear and intuitive visual representation of data trends, making it easier for users to interpret information.
- Data analysis: Line charts facilitate in-depth data analysis by highlighting patterns, correlations, and anomalies over time or continuous categories.
- Decision making: Line charts empower users to make informed decisions based on data insights, helping organizations improve performance and achieve strategic goals.
- Interactive experience: Line charts in Power Apps provide an interactive experience, allowing users to drill down into specific data points or adjust parameters for dynamic exploration.
- Communication tool: Line charts serve as effective communication tools, enabling users to present findings, share insights, and communicate trends effectively to stakeholders.
Features of line charts in Power Apps
- Customization: Users can customize line charts in Power Apps by adjusting colors, labels, axes, and other visual properties to suit their preferences and requirements.
- Data binding: Line charts seamlessly integrate with SharePoint lists and other data sources, enabling users to visualize real-time data and updates within their apps.
- Dynamic data: Line charts support dynamic data updates, ensuring that visualizations reflect changes in underlying data in real time.
- Interactivity: Users can interact with line charts by hovering over data points to view details, zooming in/out for closer inspection, and filtering data to focus on specific segments or periods.
- Cross-Platform compatibility: Line charts created in Power Apps are cross-platform compatible, allowing users to access and interact with visualizations across various devices and screen sizes.
Limitations of line charts in Power Apps
- Limited customization options: While Power Apps offers some customization options for line charts, users may find certain advanced customization features lacking compared to dedicated data visualization tools.
- Performance issues: Line charts in Power Apps may experience performance issues when handling large datasets or complex calculations, impacting responsiveness and user experience.
- Dependency on data source: Line charts rely on data from SharePoint lists or external data sources, making them dependent on the availability and accuracy of underlying data.
Step-by-step guide to creating line charts
Step-by-Step Guide to Creating Line Charts in Power Apps
- Open Power Apps.
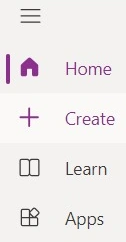
- Click on the "Create" button.

- Select "Blank app".
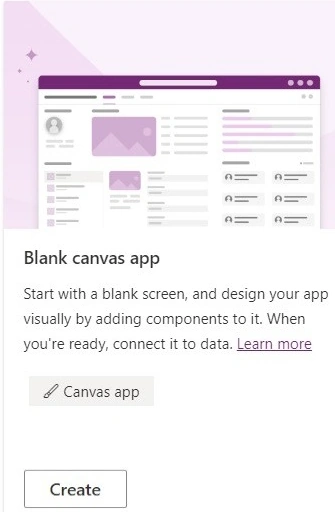
- Choose "Blank tablet app" as the app type.
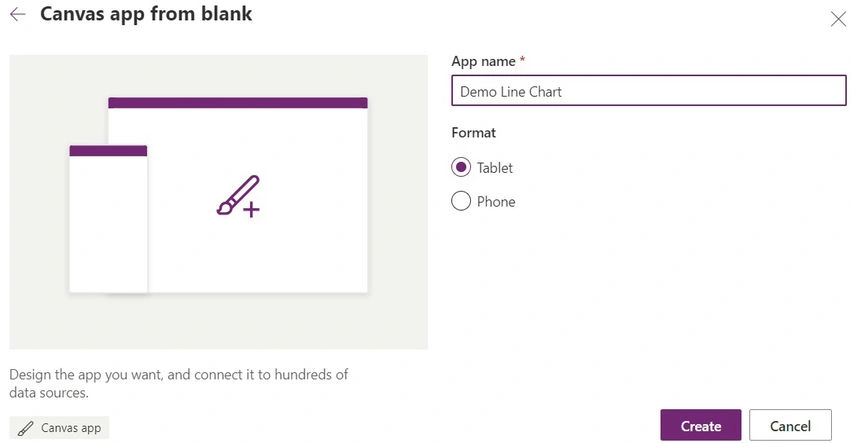
- Provide a name for your app.
- Select "Create" to proceed.

- Navigate to the "Data" tab.
- Select "Connect to data" to add a new data source.

- Choose "SharePoint" from the list of data sources.
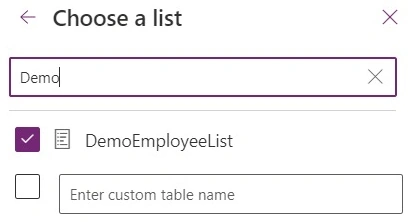
- Enter the URL of your SharePoint site and click "Go".
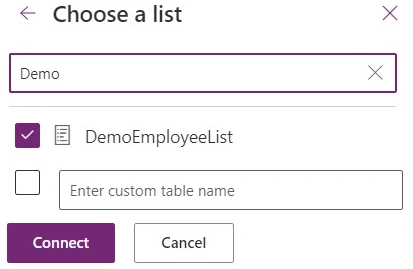
- Select the SharePoint list you want to connect to and click "Connect".
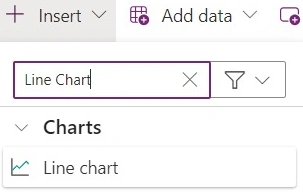
- Insert a line chart control onto your canvas.
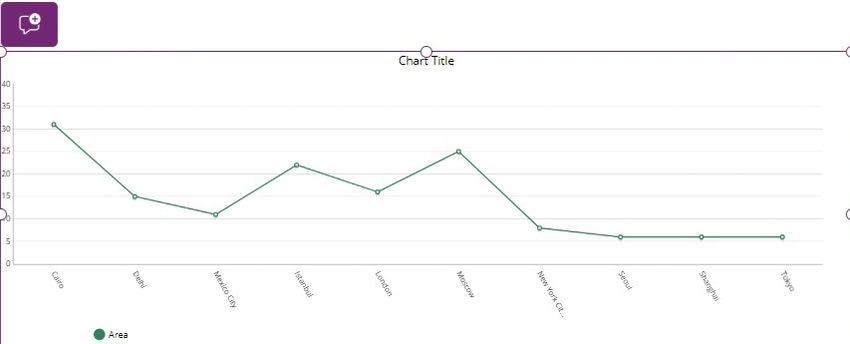
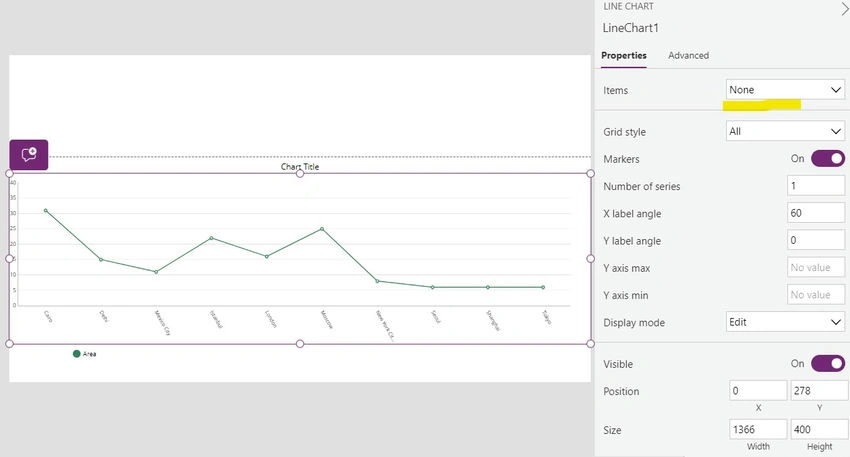
- Configure the line chart's properties, including data source, X-axis, Y-axis, and series fields.
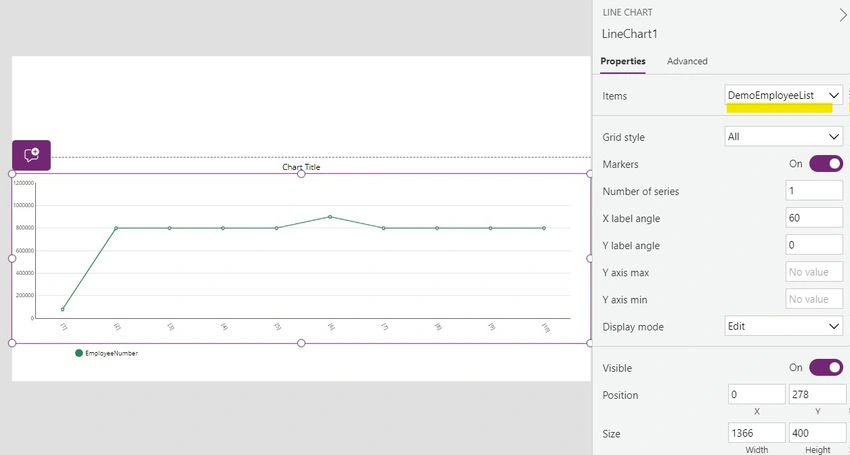
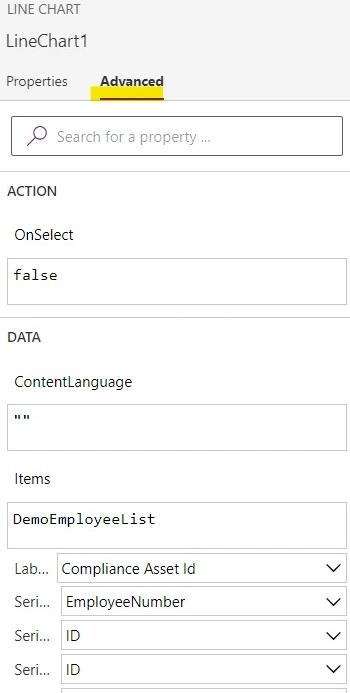
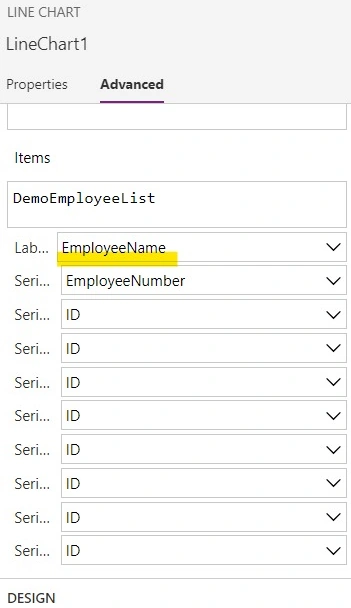
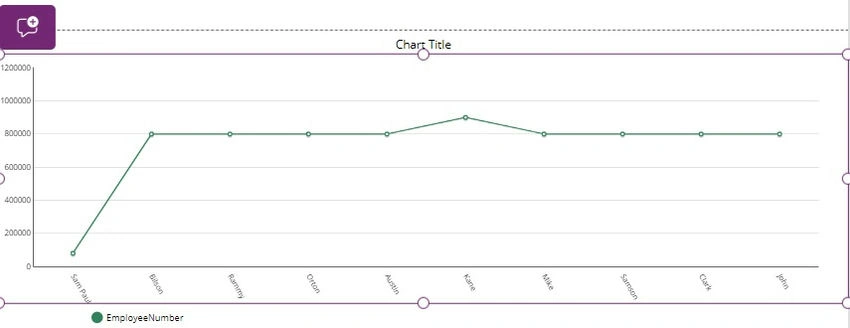
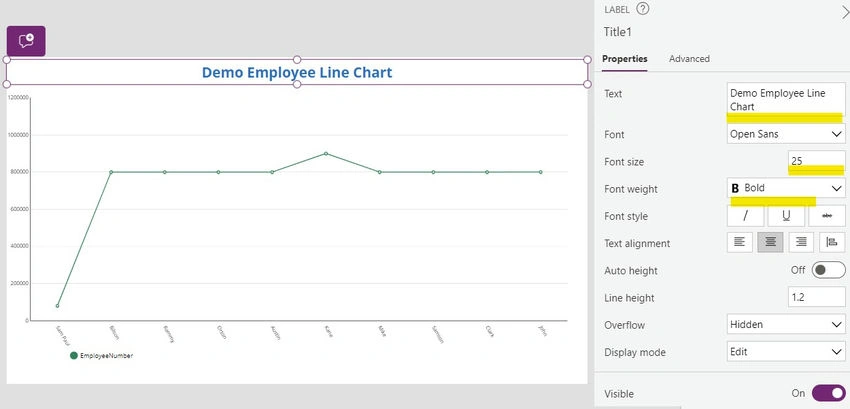
- Customize the appearance of the line chart, such as colors, labels, and axes.
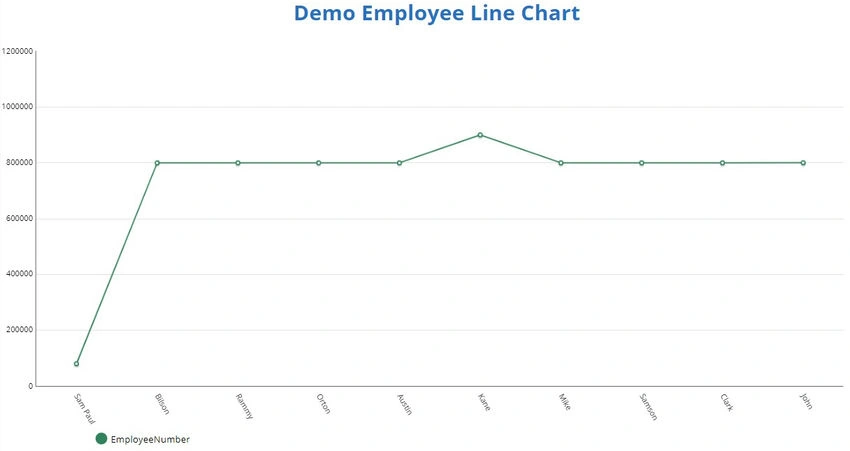
- Test your app to ensure that the line chart visualizes the SharePoint list data effectively.
Conclusion
Line charts in Power Apps offer a powerful tool for visualizing trends and patterns in SharePoint list data. By following this guide, users can leverage line charts to gain valuable insights, enhance decision-making, and communicate data-driven findings effectively. While line charts have some limitations, their benefits outweigh these drawbacks, making them indispensable for data analysis and visualization in Power Apps environments.
Join the conversation! Your thoughts help the community grow.