

Overview of Power BI
Power BI is a Microsoft Product. Power BI is a visualization tool used to analyze and represent data in visualization form. Microsoft Power BI is used to find insights and analytics within an organization's data. Power BI can help us to connect with different data sources such as databases, Files, URLs, API, and Sharepoint and build data sets, transform and clean the data into a data model, and create charts or graphs, Tables, and Metrix to provide visuals of the data.
Power BI is a collection of services, apps, and connectors that work together and form visualization from unrelated data and interactive insights. Data may be an Excel format, Object, JSON, or URL and any database like SQL Server, Oracle, Teradata, etc. Power BI easily connects to your data sources, and visualization data in a dashboard can be shared with anyone.
Elements of Power BI
Below is the list of basic elements of Power BI which helps to Design, Create, Share, and Consume business insights and Analytics in the most effectively
- Power BI Desktop-An Windows based Power BI Dashboard development environment
- Power BI service is a web-based service where the dashboard reports, Consume, and shares with the user online at a centralized location
- Power BI mobile apps –An App available in Windows, IOS, and Android that helps you to easily open and see dashboard visualization in a single click from anywhere
- Power BI Report Builder-Its used to create paginated reports to share in the Power BI Services
- Power BI Report Server-A server where you can publish your Power BI report
- Gateway-A gateway Services that make the Power BI dashboard and Data Source connection live by using an On-premises gateway installed on the system and configured in Power BI Services
Download and Installation of Microsoft Power BI Desktop
Download Microsoft Power BI 64-bit (PBIDesktopSetup_x64.exe) from the below link and install it on your system. Once installation is done start building the Dashboard using different Data sources.
https://powerbi.microsoft.com/en-us/downloads/
Installation Steps
- Click on PBIDesktopSetup_x64.exe.
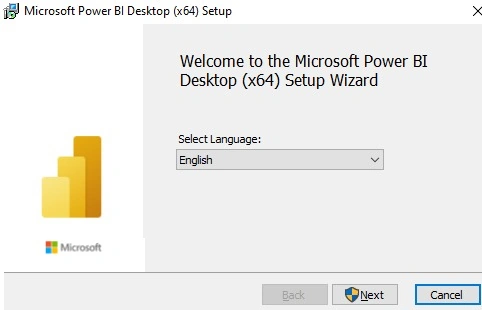
- Once exe opens click on the next button as the below snapshot
- Follow next-next till below below snapshot
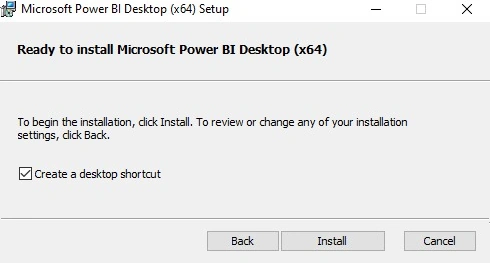
- Click on install then it start installing Power BI on your system
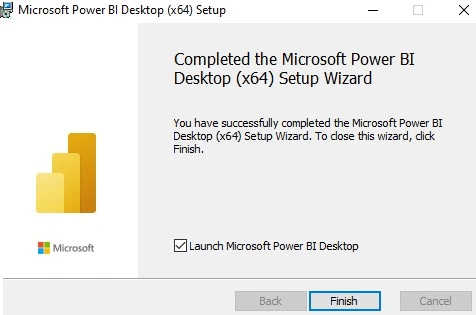
- Click on finish. Power BI desktop icon created on your system desktop.
- Open Power BI Desktop and a welcome screen is displayed
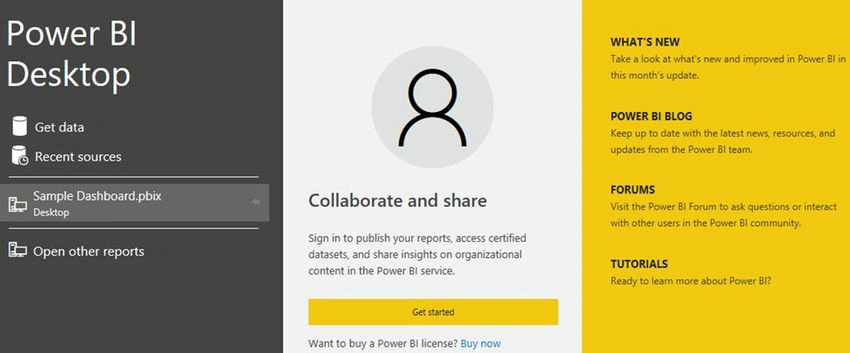
- You can get data or see your recently used data source or you can open other existing reports directly from the above screen. Once you close the screen report view of the Power BI desktop is visible.
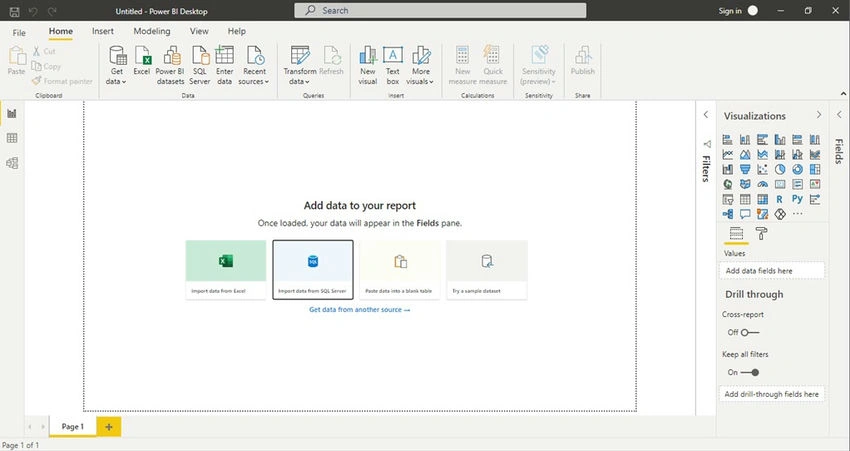
How to connect Power BI with Data Source?
Once Power BI dashboard you are ready to connect with various data sources. The below image shows how to connect with the data source select Home from Riboon and click on Get Data->Select Data Source
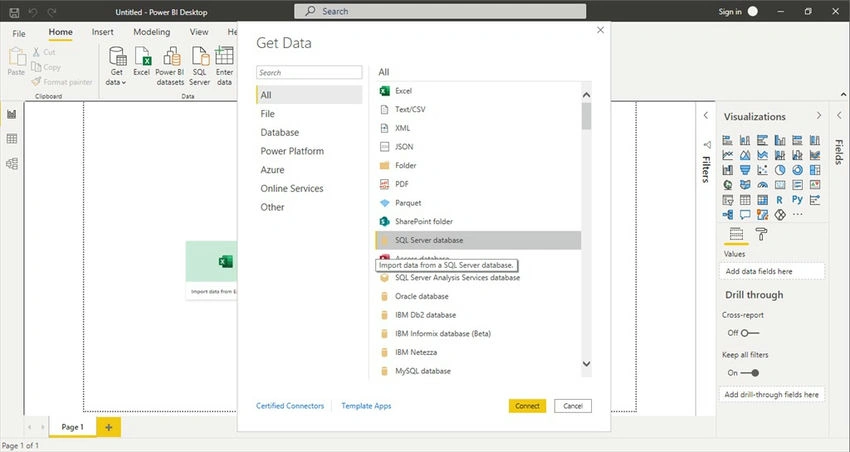
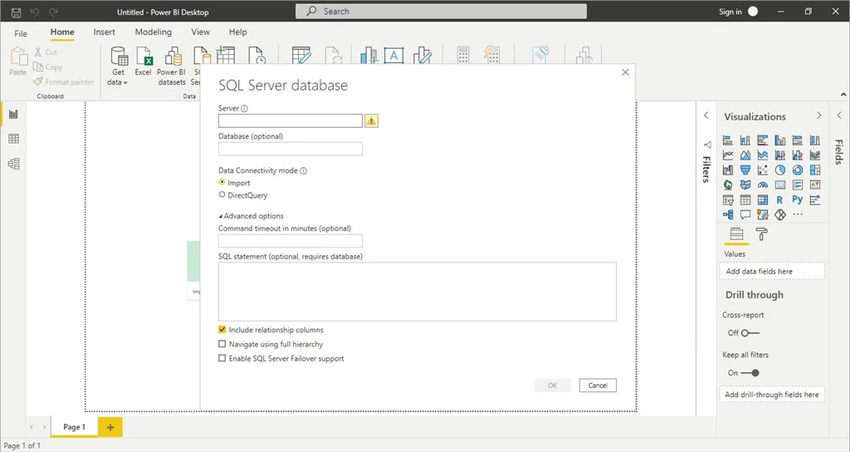
Select the data source as per your choice here I am selecting Import data from the Sql server. Just click on Connect. Once you click on connect it asks for your Sql Server server details as below give the Sql server server name and select data Connectivity mode. Click on the ok button once ok after the server user ID and password and then connect
Data connectivity mode
Import mode
Import Data Connectivity mode import data into the Power BI cache. Import connection is recommended when the data size is less than 1 GB and the data is not frequently changed. In Import mode schedule refresh is used to get the latest data. Import mode of connection provides you high performance as compared to direct query mode.
Direct query mode
DirectQuery Connectivity mode is directly connected to the database and data. DirectQuery mode is used when the data volume is large and data will be changed frequently. It provides real-time solutions. In direct query mode, every time a query is triggered in the database, and fetches the latest data from the database which reduces performance as every time hits to database.
Select the Database and set of tables or views from which you want to build a dashboard
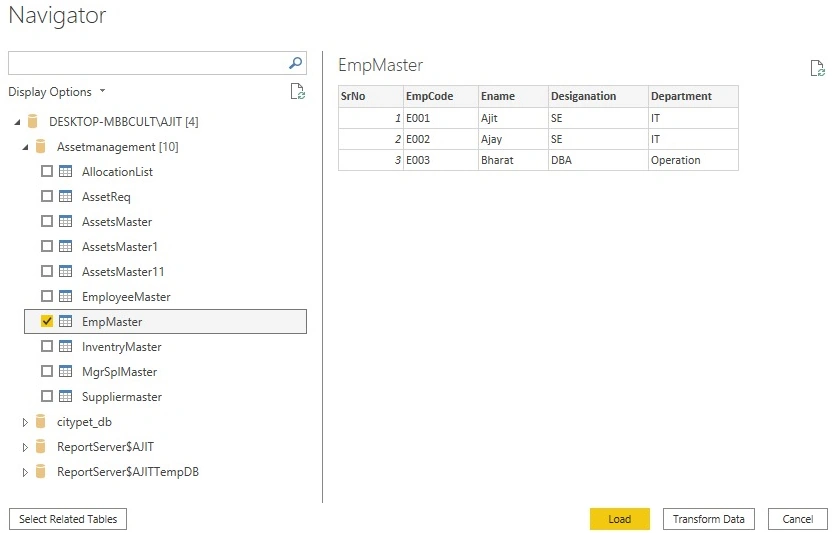
You can load data or transform data. Once you load data it creates a dataset of your data without changes. But if you want to do some customization in the table then you need to click on transform data and you can change data type add column transform data and many more then click on close apply. Once closed and applied, a new dataset is created with the changes you have made.
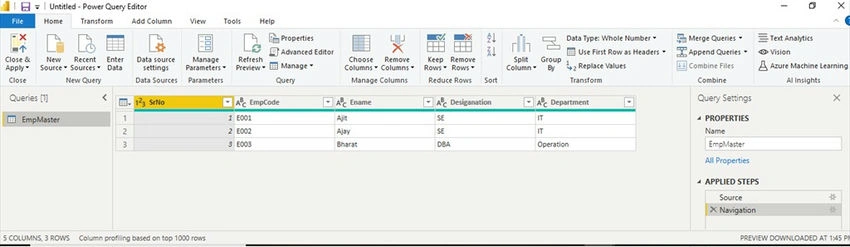
Report build
Once the data is loaded after changes made in the table you can begin with build reports.
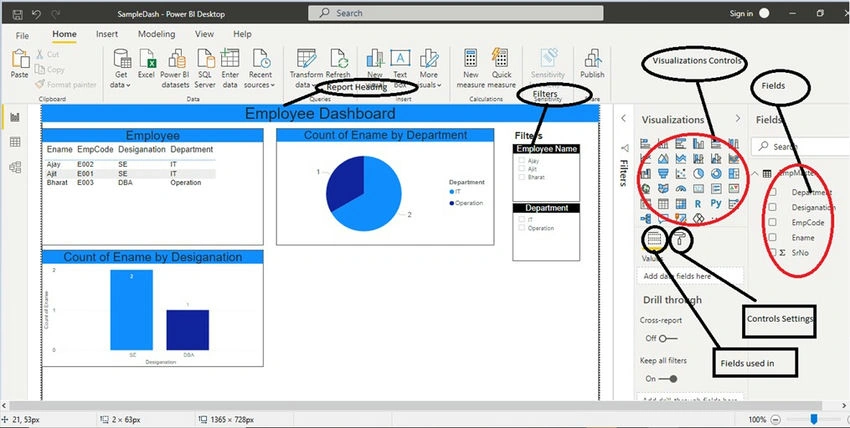
Sections in Report View
- Ribbon
- Report View
- Pages
- Visualizations
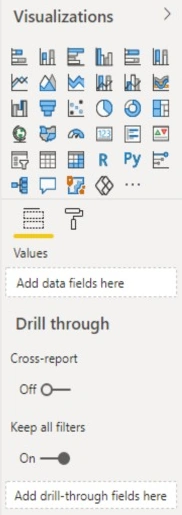
- Fields
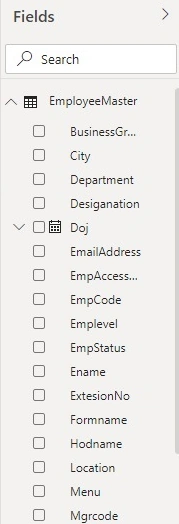
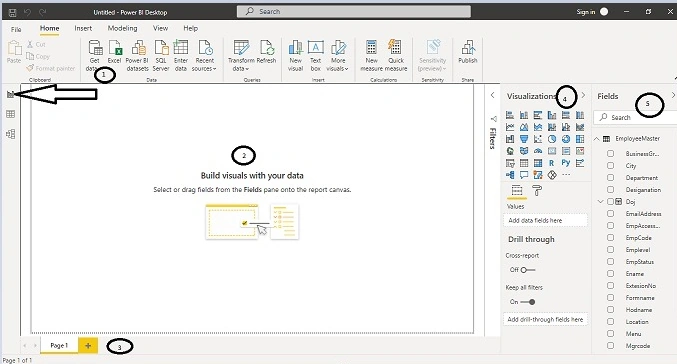
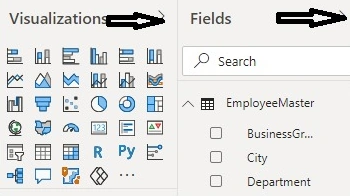
- The visualization and Fields pane can be collapsed by selecting the arrow to provide more space for the report view
- To create visualization drag a field from the fields list onto the Report View as per the below snapshot
Join the conversation! Your thoughts help the community grow.