

Overview
Here, I am writing the introduction series on all Power BI visuals so that the end user or beginner will gain a basic idea of how visuals work. In this series, we will learn about each OOTB Power BI visuals step by step.
Before you start with this tutorial, I recommend you to go through my previous articles.
- Introduction to Power BI Visual Part 1
- Introduction to Power BI Visual Part 2
In this article, we will talk about the below two visuals provided by Power BI Desktop OOTB.
1. Clustered Bar Chart
2. Clustered Column Chart
We can find this visual in OOTB Power BI. Please refer the below screenshot for it.
Let’s get started!
Clustered Bar Chart and Clustered Column Chart
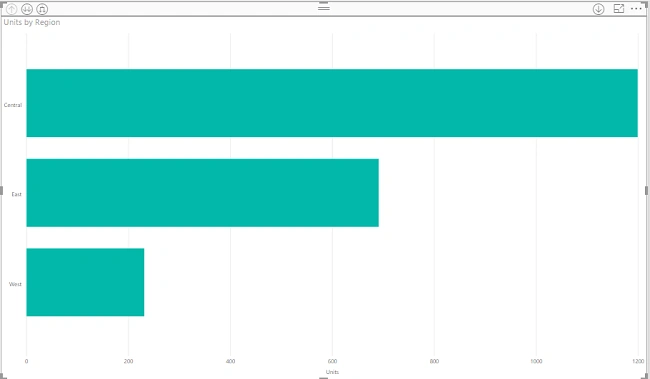
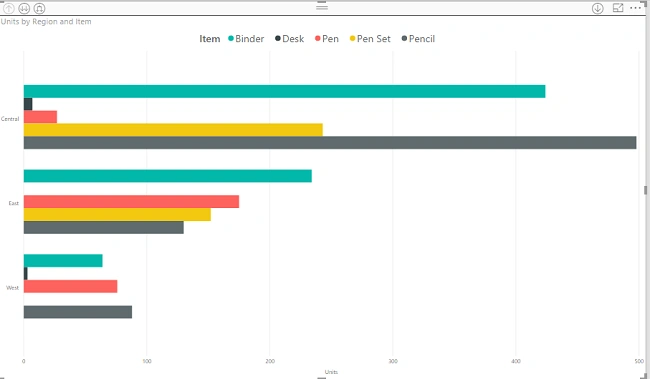
The below screenshot shows clustered bar chart. This chart shows values (sum, count etc.) on X-axis and group by data on Y-axis.
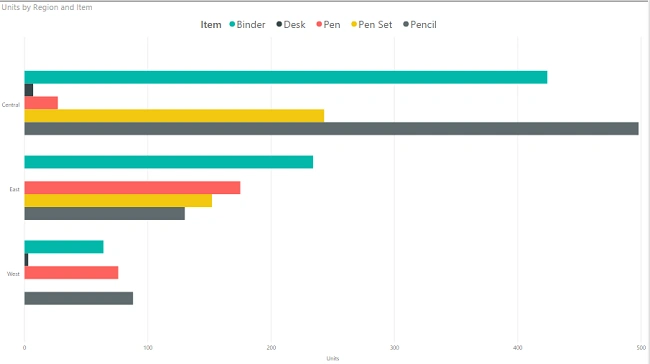
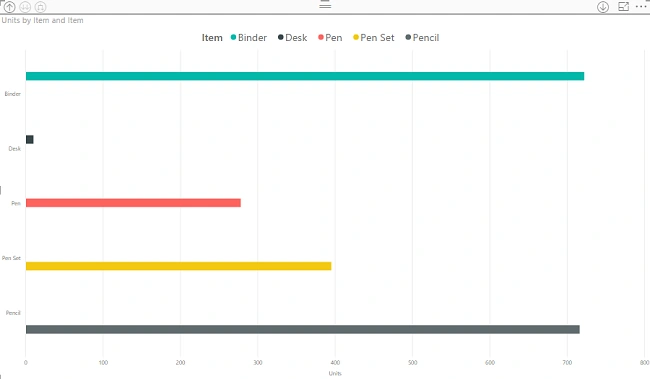
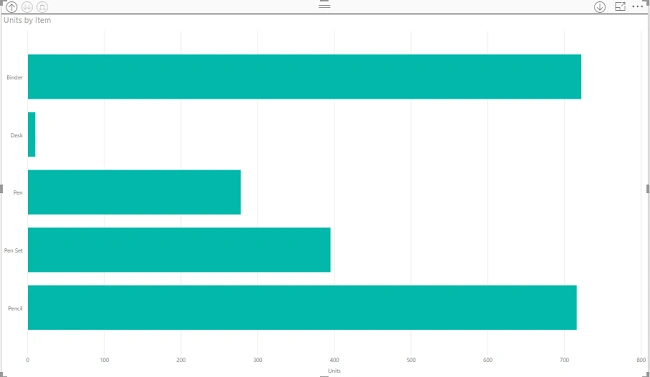
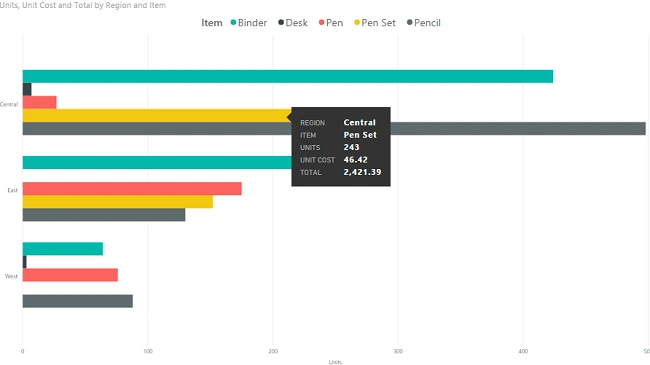
The following screenshot shows the drilled down visual of Clustered Bar Chart.
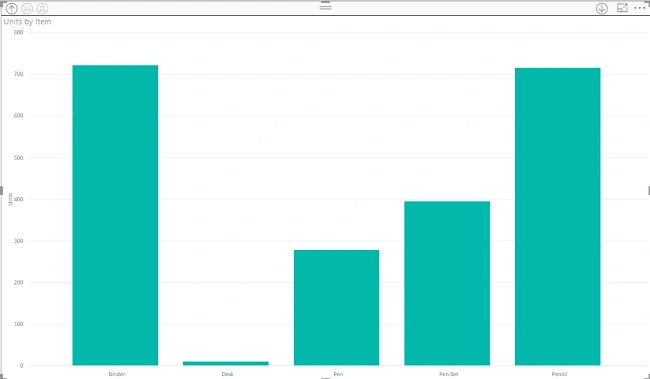
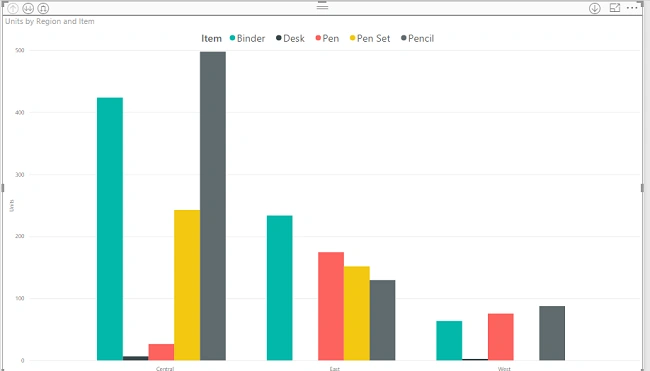
Below screenshot shows the clustered column chart. This chart shows values (sum, count etc.) on Y-axis and group by data on X-axis.
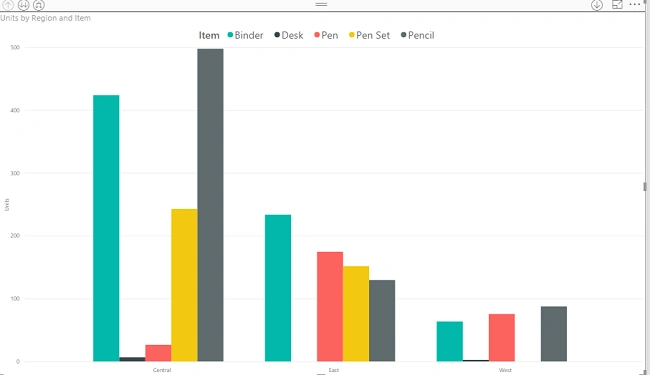
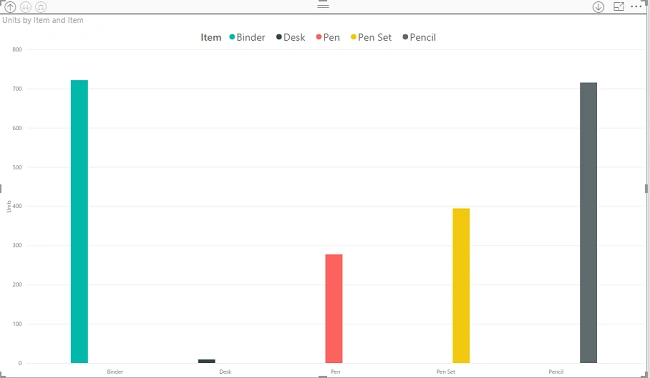
The following screenshot shows the drilled down visual of Clustered Column Chart.
Now, let’s understand each term in detail.
We should set the following parameters to create a Clustered Bar Chart and Clustered Column Chart.
Ex: We will learn this chart using Sales data which has the following columns, and the data will look like this.
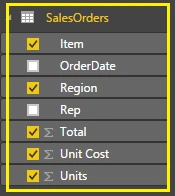
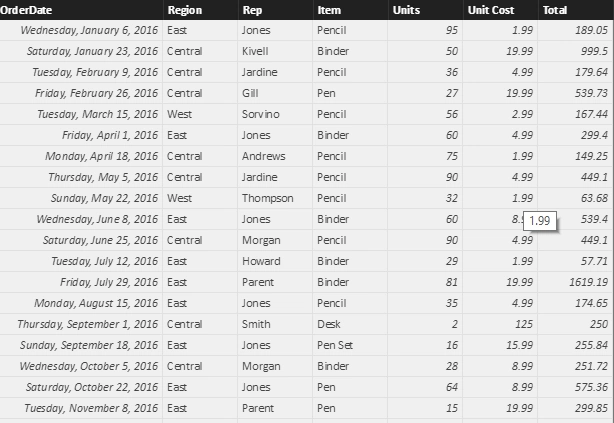
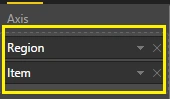
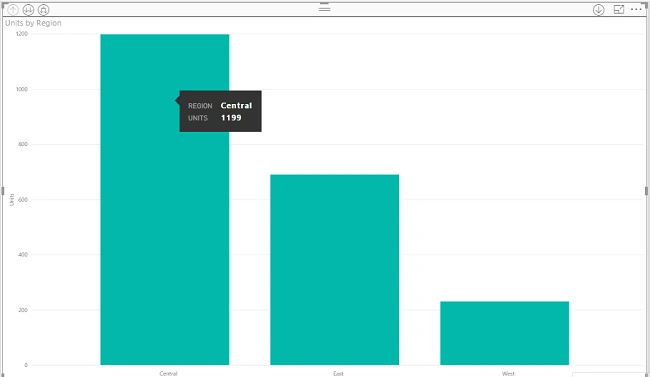
I want to prepare a chart for total sales done by a company by region and item. I need total sales by region and when I drilled down through the region, it will show me sales data by item.
So, let’s get started!
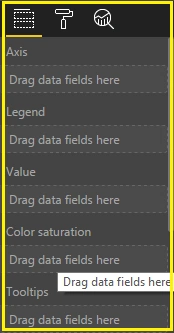
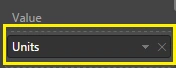
Here, these are the most important properties to create this chart.
ShraddhaPosted Apr 10, 2018, 12:33 AM
Is there combination of Clustered and Stack Chart