

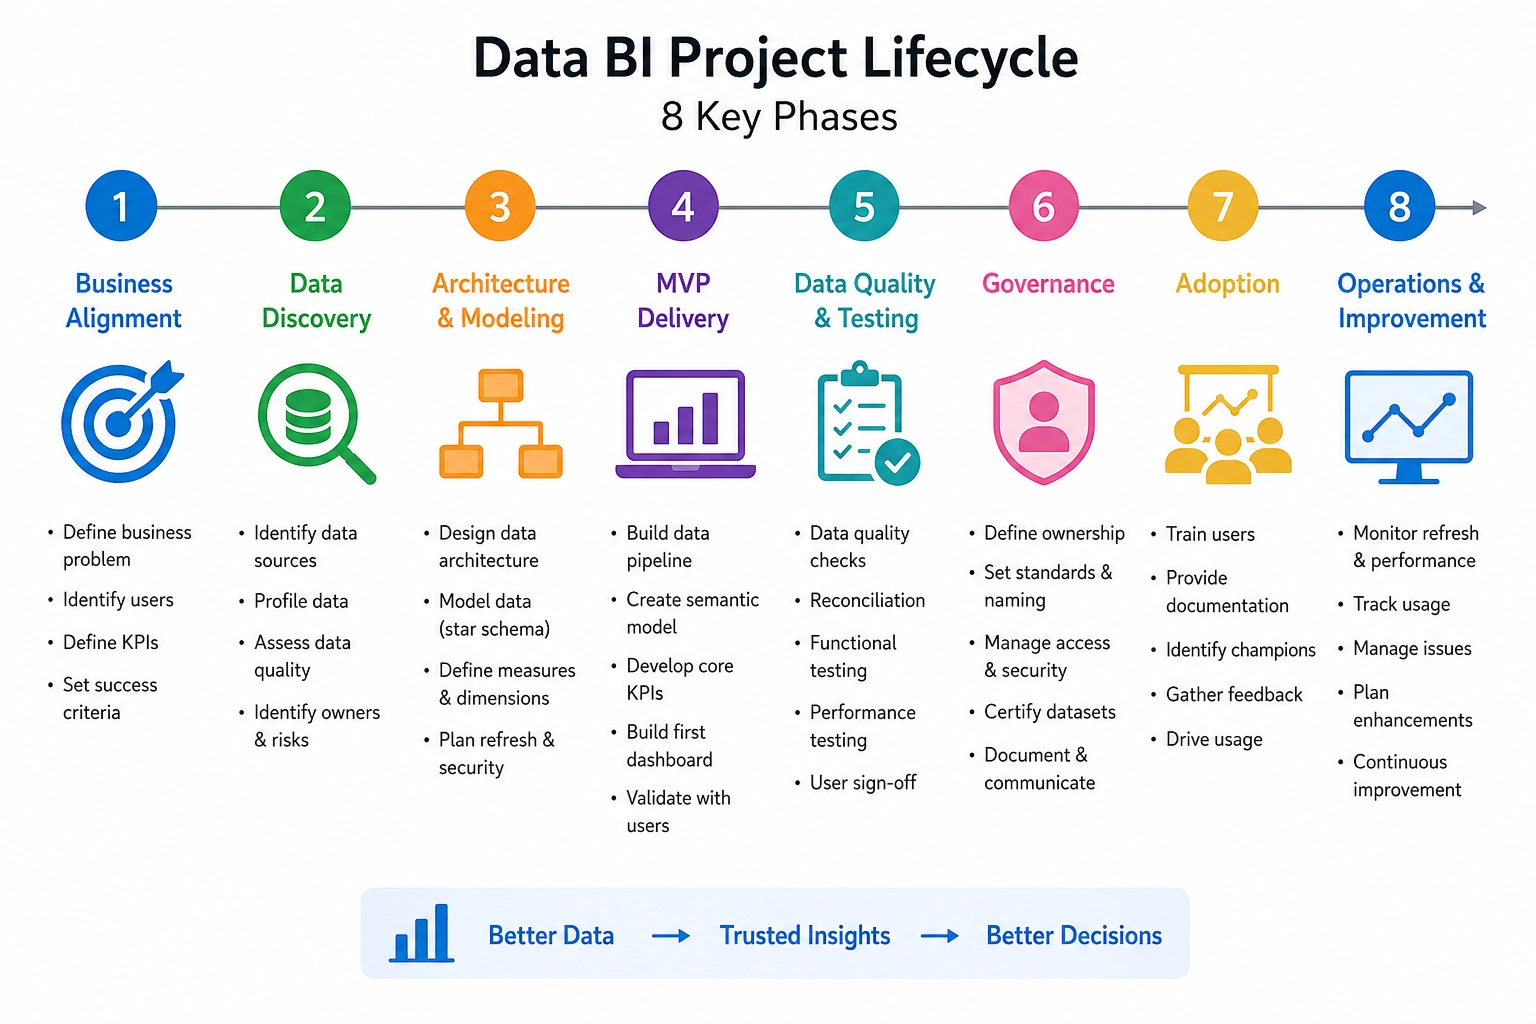
Managing a data BI project can look simple from the outside: connect to data, create a model, build dashboards, and publish reports. In reality, a BI project is rarely only about dashboards. It is about business definitions, data quality, governance, architecture, adoption, security, performance and trust.
A successful BI project does not only answer the question: “Can we build the report?”
It answers a more important question: “Can the business trust this data and use it to make decisions?”
That is why data BI project management can be complicated. Not because the tools are always difficult, but because the project sits between business, IT, data engineering, governance, finance, operations and end users.
Why data BI projects become complicated ?
A BI project becomes complex when the team underestimates the gap between raw data and business ready insight.
For example, a sales dashboard may sound simple. But before building it, the team must agree on questions such as:
What is a sale?
Is it order date, invoice date, delivery date, or payment date?
Should cancelled orders be included?
Which currency should be used?
Who owns the definition?
How often should the data refresh?
Who can see which region or customer?
These questions are not technical details. They are the foundation of trust.
The main complexity of BI projects comes from five areas:
Business ambiguity : Different teams often use different definitions for the same KPI.
Data quality problems : Source systems may contain duplicates, missing values, wrong codes, inconsistent dates or outdated mappings.
Multiple source systems : APIs, Excel files, ERP systems, CRM systems, databases, and manual files often need to be combined.
Governance and security : BI projects must define ownership, access, sensitivity, certification, lineage and compliance.
Adoption : A report is not successful just because it is published. It is successful when people actually use it and trust it.
The most common challenges in data BI projects
Many BI projects start with a request like: “We need a dashboard.”
But a dashboard is not a requirement. It is a delivery format.
A better starting point is:
What decision will this dashboard support?
Who will use it?
What actions should the user take after seeing the numbers?
Which KPIs are critical?
What does success look like?
Without this clarity, the project becomes a report factory. The team keeps building pages but the business value remains unclear.
Also, one of the biggest problems in BI is that different departments calculate the same KPI differently.
For example:
Finance calculates revenue based on invoices.
Sales calculates revenue based on closed opportunities.
Operations calculates revenue based on delivered orders.
All three can be valid but if the BI team does not document the definition, users will lose trust.
This is why a semantic layer, certified dataset, or governed metrics layer is important. The goal is not only to create visuals, but to create one trusted version of the truth.
Let's not forget that bad data is one of the most expensive problems in BI projects.
Common examples include:
Duplicate customers
Missing product codes
Invalid dates
Wrong country mappings
Different naming conventions
Manual Excel corrections
Historical data not aligned with current business rules
Data quality should not be checked only at the end. It should be part of the project from the beginning through profiling, validation rules, reconciliation, monitoring and business sign-off.
Many BI failures happen because teams underestimate the effort required to integrate data.
Connecting to one table is easy. Building a reliable data pipeline is harder.
A real BI solution often needs:
Data extraction
Incremental loading
Data cleaning
Business transformations
Historical tracking
Error handling
Logging
Monitoring
Security
Refresh optimization
Performance tuning
If the integration layer is weak, the report layer will never be stable.
Every important data asset needs an owner.
Who owns the customer table?
Who validates revenue?
Who approves KPI definitions?
Who handles data quality issues?
Who maintains the Power BI semantic model?
Who manages workspace access?
When ownership is unclear, problems remain unresolved. BI teams become responsible for everything, even when they do not control the source data.
Performance is often treated as a final optimization step. That is a mistake.
Poor modeling decisions at the beginning can create slow reports later. Examples include:
Too many columns imported
Many-to-many relationships used without control
Bi-directional filters everywhere
Heavy DAX measures
Large fact tables without aggregation strategy
No incremental refresh
Poor star schema design
Too many visuals on one page
Performance should be designed not repaired.
A technically perfect dashboard can still fail if users do not understand it or trust it.
Low adoption usually happens when:
Users were not involved early
Reports do not match real business processes
KPI definitions are not documented
The dashboard is too complex
Training is missing
There is no support process
Users continue using Excel because they trust it more
BI adoption requires communication, training, documentation, and continuous improvement.
The biggest mistakes in data BI projects
Mistake 1: Starting with the tool instead of the business problem
Many teams start with Power BI, Tableau, Fabric, Databricks, or a cloud platform before defining the business outcome.
Technology should support the business goal, not replace it.
A better approach is:
Business question → KPI definition → data source → model → report → action.
Mistake 2: Building Too Much Before Validating
A common mistake is trying to deliver the full enterprise BI solution in one big release.
This creates long delivery cycles and late feedback.
A better approach is to build a small end-to-end MVP:
One business process
One fact table
Few dimensions
Few KPIs
One dashboard
Validated by real users
Then iterate.
Mistake 3: No Data Quality Framework
Many projects assume that source data is correct. This is dangerous.
Every BI project should include:
Data profiling
Completeness checks
Duplicate checks
Reconciliation with source systems
Business validation
Exception reports
Monitoring alerts
Clear data ownership
If data quality is not measured, it cannot be managed.
Mistake 4: Treating BI as only reporting
Modern BI is not only reporting. It is part of the decision-making system of the company.
A BI project should include:
Data architecture
Governance
Semantic modeling
Security
Data quality
Documentation
Adoption
Monitoring
Lifecycle management
If BI is treated only as “make me a dashboard” the solution becomes fragile.
Mistake 5: No governance for self-service BI
Self-service BI is powerful but without governance it can create chaos.
Common symptoms include:
Many duplicated datasets
Different versions of the same KPI
Uncertified reports used for executive decisions
Users exporting data manually
No workspace standards
No naming conventions
No ownership
No monitoring
Good governance does not mean blocking users. It means giving users freedom with clear rules.
Mistake 6: Ignoring change management
A BI project changes how people work. Some users may resist because they are used to Excel, manual reports or local definitions.
Change management should include:
Communication
Training
Champions inside business teams
Documentation
Office hours
Feedback loops
Clear support channels
A dashboard without adoption is only a technical artifact.
Frameworks for managing a data BI Project
There is no single perfect framework but several frameworks can be combined.
1. Kimball DW/BI Lifecycle
The Kimball methodology is useful for data warehouse and BI projects. It focuses on business requirements, dimensional modeling, ETL design, BI application design, deployment and maintenance.
It is especially useful when building star schemas, conformed dimensions and enterprise reporting models.
We can use it when we need strong dimensional modeling and a structured BI delivery approach.
2. DAMA-DMBOK
DAMA-DMBOK is a data management framework. It is useful for governance, data quality, metadata, data architecture, security, master data and data lifecycle management.
We can use it when the BI project needs strong governance and enterprise data management practices.
3. CRISP-DM
CRISP-DM is often used for analytics and data science projects. Its phases are:
Business understanding
Data understanding
Data preparation
Modeling
Evaluation
Deployment
For BI projects, the most important lesson from CRISP-DM is to start with business understanding not with development.
4. DataOps
DataOps applies software engineering and operational discipline to data pipelines.
It encourages:
Automation
Testing
Monitoring
Version control
Continuous delivery
Collaboration
Fast feedback
We can use DataOps when the BI project depends on recurring data pipelines, frequent releases, and production reliability.
Witnesses from big companies: mistakes and lessons
Airbnb: From data chaos to trusted metrics
Airbnb analytics journey shows that even very data-driven companies face growing pains. In its early days, Airbnb had a very simple analytics setup, and as the company grew, it faced challenges around trusted metrics, data quality, and scalable analytics.
To deal with this, Airbnb built Minerva, a metrics platform designed to create a single source of truth for analytics, reporting, and experimentation. Airbnb also invested in data quality scoring and internal data education through Data University.
BI maturity is not only about dashboards. It requires common metrics, data quality, education and a culture of trust.
LinkedIn: Solving data discovery with dataHub
At large scale, one of the biggest problems is not only storing data. It is helping people find the right data.
LinkedIn built DataHub, originally connected to its internal metadata and discovery needs, to help users discover datasets, metrics, models, and metadata.
As data grows, metadata becomes essential. Without a data catalog, lineage and ownership, teams waste time searching for data or using the wrong data.
Uber: Real-time data requires strong architecture
Uber operates in a highly real-time environment where data is used by engineers, data scientists, executives, and operations teams. Its data infrastructure must support many use cases such as incentives, fraud detection, machine learning, and operational decisions.
Uber’s experience shows that at scale, data platforms must handle volume, speed, reliability, and different types of users.
The lesson: BI architecture must be designed for the business operating model. A batch report may be enough for finance, but operations may need near real-time analytics.
Target Canada: Bad data can break business execution
Target Canada is a famous example of how poor data, inventory problems, and aggressive timelines can damage a major transformation. The company expanded quickly, but inventory and supply chain data problems contributed to empty shelves, overloaded distribution centers and poor customer experience.
Data quality is not a technical detail. In retail, wrong product, inventory or supply chain data directly affects revenue, operations and customer trust.
Knight Capital: Lack of controls can be catastrophic
Knight Capital suffered a major technology incident in 2012 after a software deployment problem led to millions of erroneous orders and a massive financial loss.
Although this was not a BI dashboard project, the lesson is very relevant for data and BI teams: production systems need controls, monitoring, alerts, rollback plans and clear incident response.
The lesson: never deploy critical data or analytics systems without testing, monitoring, and operational safeguards.
What Makes a BI Project Successful?
A successful BI project usually has these characteristics:
The business problem is clear.
The KPI definitions are documented.
The data model is simple and scalable.
The data quality is measured.
The semantic layer is trusted.
Security is designed from the beginning.
The report is easy to use.
Users are trained.
Ownership is clear.
The solution is monitored after go-live.
Success is not the number of dashboards delivered. Success is the number of better decisions enabled.
My final thoughts
Yes, managing a Data BI project can be complicated. But it becomes much easier when the team uses a structured framework and treats BI as a business transformation project not just a reporting task.
The biggest mistakes are not usually technical. They are usually related to unclear requirements, poor data quality, weak ownership, missing governance, and low adoption.
The best BI teams do not only build reports. They build trust.
A good BI project manager should always ask:
What decision are we supporting?
Can the users trust the data?
Who owns the definition?
How will we measure adoption?
How will we maintain this after go-live?
When those questions are answered, BI becomes more than dashboards. It becomes a reliable decision-making system for the organization.
Join the conversation! Your thoughts help the community grow.