

Background
The ASP.Net Chart is a powerful control that creates interactive charts. Today we will discuss the Kagi type chart of ASP.Net. So let us start to learn about these chart type controls step-by-step.
Now let us learn about the properties of the Kagi charts. A Kagi chart type has the following common properties:
- AlternetText: Sets the alternate text when the image is not available.
- Annotation: Stores the chart annotations.
- AntiAliasing: Sets a value that determines whether anti-aliasing is used when text and graphics are drawn.
- BackGradientStyle: Sets the orientation for the background gradient for the Chart control. Also determines whether a gradient is used, the default is None.
- Backcolor: Sets the background color for a chart, the default color is White.
- BackImage: Sets the background image for the chart control.
- BackHatchStyle: Sets the hatching style for the chart control, the default is None.
- Height: Sets the height for the chart control.
- Width: Sets the width for the chart control.
- Palette: Sets the style with the color for the chart control, the default style is Chocolate.
- PaletteCustomColors: Sets the custom color for the chart control.
- Series: Sets the series collection for the chart control.
- Legends: Sets the series of legends to the chart.
Now let us show the preceding explanation with a practical example by creating a simple web application.
Step 1
Use the following script to create a table for the chart data:
CREATE TABLE [dbo].[orderdet](
    [id] [int] IDENTITY(1,1) NOT NULL,
    [Month] [varchar](50) NULL,
    [Orders] [int] NULL,
 CONSTRAINT [PK_Order Table] PRIMARY KEY CLUSTERED
(
    [id] ASC
)WITH (PAD_INDEX = OFF, STATISTICS_NORECOMPUTE = OFF, IGNORE_DUP_KEY = OFF, ALLOW_ROW_LOCKS = ON, ALLOW_PAGE_LOCKS = ON) ON [PRIMARY]
) ON [PRIMARY]
Now the design will look as follows:
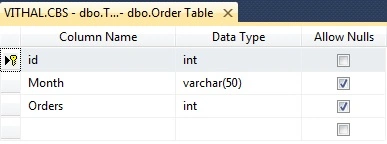
Now insert the records using the following script:
SET IDENTITY_INSERT [dbo].[orderdet] ON

GO
INSERT [dbo].[orderdet] ([id], [Month], [Orders]) VALUES (1, N'Jan', 0)
GO
INSERT [dbo].[orderdet] ([id], [Month], [Orders]) VALUES (2, N'Feb', 5)
GO
INSERT [dbo].[orderdet] ([id], [Month], [Orders]) VALUES (3, N'March', 20)
GO
INSERT [dbo].[orderdet] ([id], [Month], [Orders]) VALUES (4, N'April', 40)
GO
INSERT [dbo].[orderdet] ([id], [Month], [Orders]) VALUES (5, N'May', 15)
GO
INSERT [dbo].[orderdet] ([id], [Month], [Orders]) VALUES (6, N'Jun', 60)
GO
INSERT [dbo].[orderdet] ([id], [Month], [Orders]) VALUES (7, N'July', 75)
GO
INSERT [dbo].[orderdet] ([id], [Month], [Orders]) VALUES (8, N'Aug', 80)
GO
INSERT [dbo].[orderdet] ([id], [Month], [Orders]) VALUES (9, N'Sep', 85)
GO
INSERT [dbo].[orderdet] ([id], [Month], [Orders]) VALUES (10, N'Oct', 100)
GO
INSERT [dbo].[orderdet] ([id], [Month], [Orders]) VALUES (11, N'Nov', 2)
GO
INSERT [dbo].[orderdet] ([id], [Month], [Orders]) VALUES (12, N'Dec', 90)
GO
SET IDENTITY_INSERT [dbo].[orderdet] OFF
Go
After running the preceding script the records in the table will look as follows:

Step 2
Create a Stored Procedure to fetch the records from the database.
Create procedure [dbo].[GetCharData]
(
@id int =null

)
as
begin
Select Month,Orders from Orderdet
End
Step 3
Create a Web Application. Create the website with:
- "Start" - "All Programs" - "Microsoft Visual Studio 2010".
- "File" - "New Project" - "C#" - "Empty Website" (to avoid adding a master page).
- Provide the project a name such as "UsingKagiChart" or another as you wish and specify the location.
- Then right-click on the Solution Explorer and select "Add New Item" then select Default.aspx page.
- Drag and Drop a Chart control from the ToolBox onto the Default.aspx page.
Now the Default.aspx source code will be as follows:
<%@ Page Language="C#" AutoEventWireup="true" CodeFile="Default.aspx.cs" Inherits="_Default" %>

<%@ Register Assembly="System.Web.DataVisualization, Version=4.0.0.0, Culture=neutral, PublicKeyToken=31bf3856ad364e35"
    Namespace="System.Web.UI.DataVisualization.Charting" TagPrefix="asp" %>
<!DOCTYPE html PUBLIC "-//W3C//DTD XHTML 1.0 Transitional//EN" "http://www.w3.org/TR/xhtml1/DTD/xhtml1-transitional.dtd">
<html xmlns="http://www.w3.org/1999/xhtml">
<head runat="server">
    <title>Article by Vithal Wadje</title>
</head>
<body bgcolor="blue">
    <form id="form1" runat="server">
    <h4 style="color: White;">
        Article for C#Corner
    </h4>
    <asp:Chart ID="Chart1" runat="server" BackColor="128, 64, 0" BackGradientStyle="LeftRight"
        BorderlineWidth="0" Height="340px" Palette="None" PaletteCustomColors="64, 0, 64"
        Width="360px" BorderlineColor="192, 64, 0" BackHatchStyle="Percent10">
        <Series>
            <asp:Series Name="Series1"  YValuesPerPoint="1">
            </asp:Series>
        </Series>
        <ChartAreas>
            <asp:ChartArea Name="ChartArea1">
            </asp:ChartArea>
        </ChartAreas>
    </asp:Chart>
    </form>
</body>
</html> 

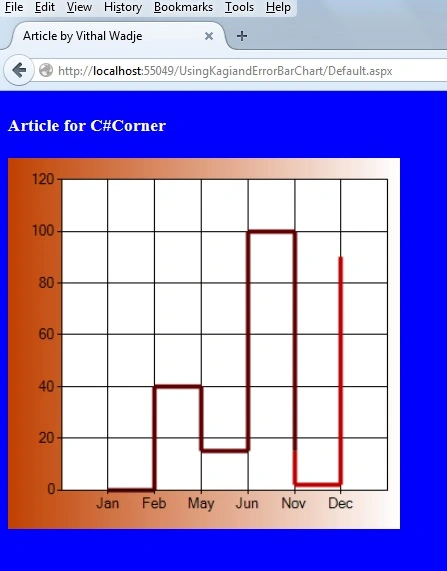
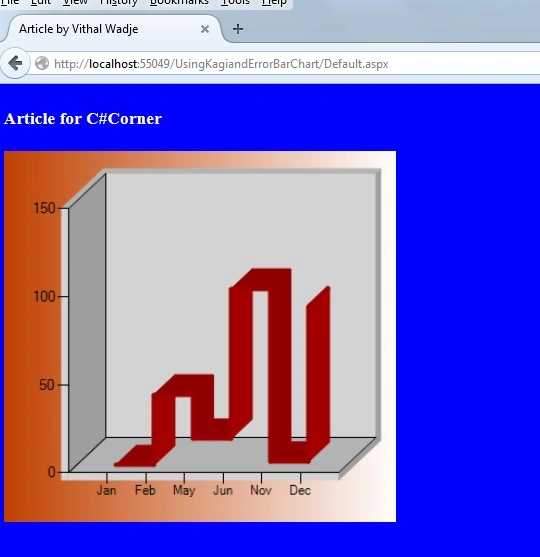
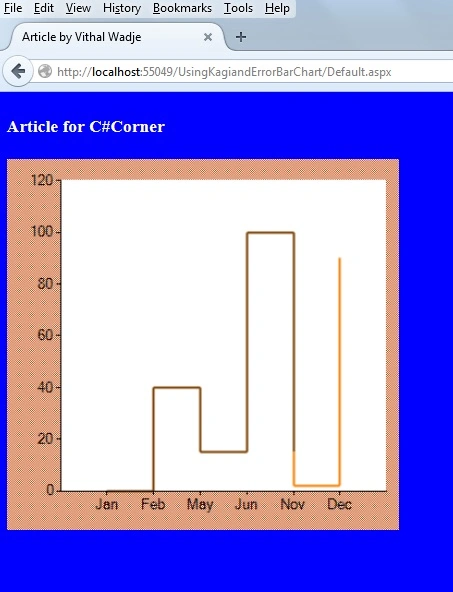
Vithal WadjePosted Jan 2, 2015, 12:23 AM
Thanks saber sir
Saber ShaikhPosted Jan 1, 2015, 11:27 PM
NICE ARTICLES
Vithal WadjePosted Jan 1, 2015, 8:20 AM
Thanks jeetendra sir
Vithal WadjePosted Jan 1, 2015, 8:20 AM
Thanks kP sir for your words
K P Singh ChundawatPosted Jan 1, 2015, 7:59 AM
Vithal Wadje Sir....Great explanation...
Jeetendra GundPosted Jan 1, 2015, 7:31 AM
Great work sir