

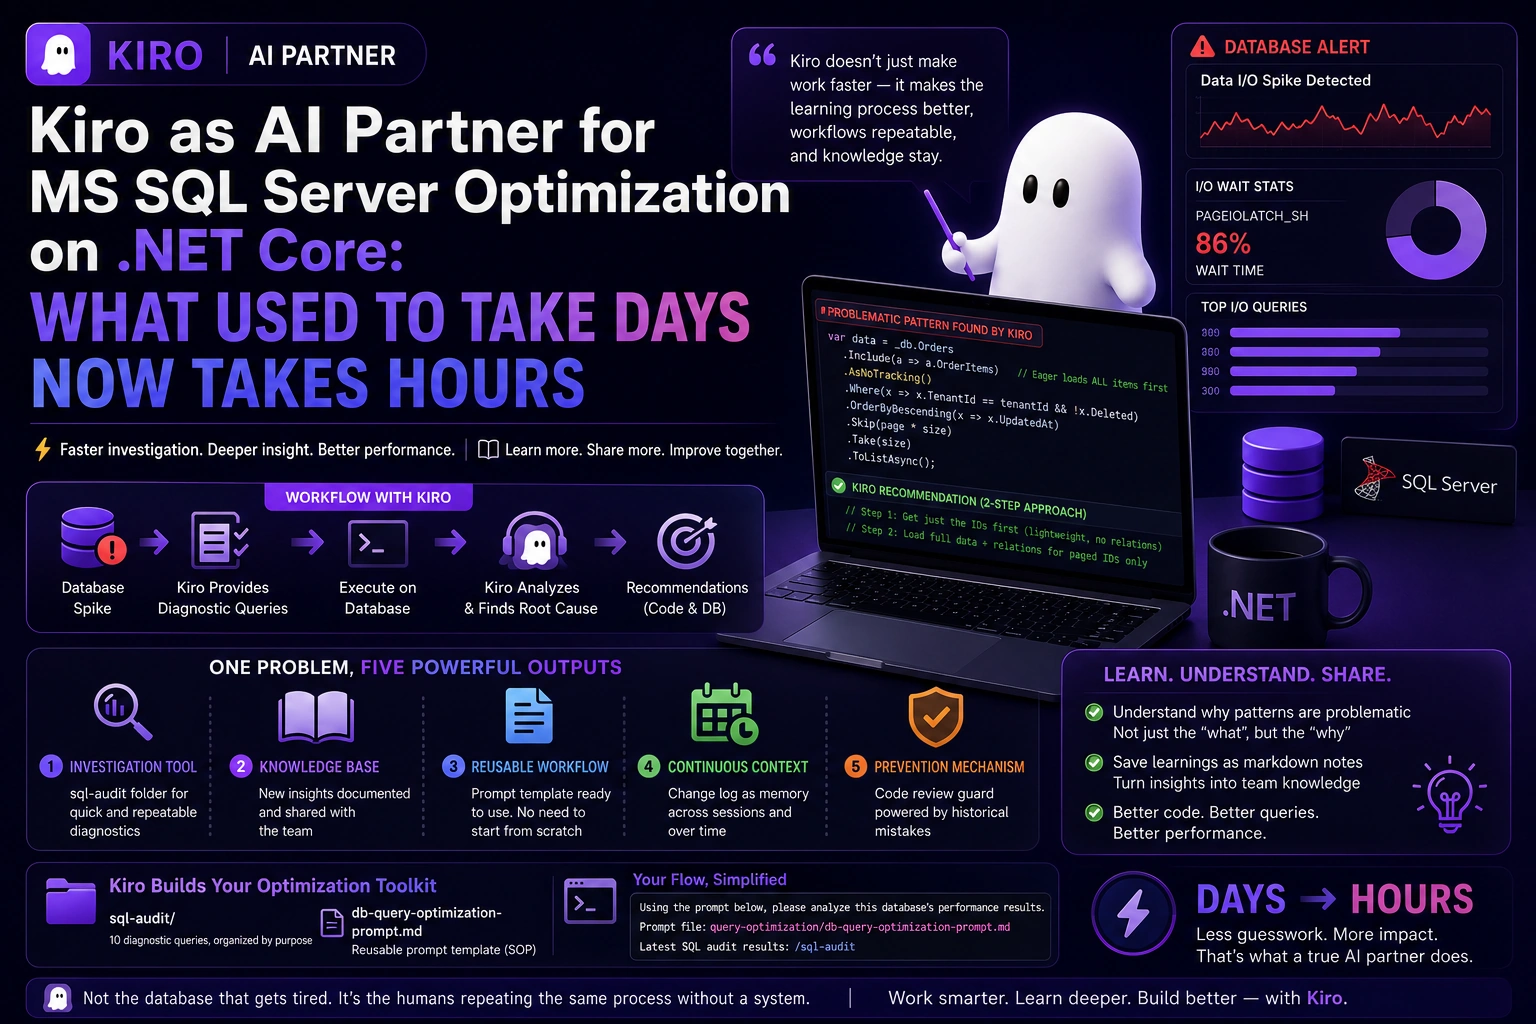
Finding the query behind a database spike used to take days. The person investigating was exhausted, and the person fixing it was even more exhausted. Now? A few hours — and as a bonus, I actually learned new things along the way.
Here's the story. If you've ever worked on an application that uses an ORM (Object-Relational Mapping — basically an "auto-translator" between your code and the database), you've probably experienced this: the database suddenly slows down, you get the raw query that's causing trouble, but in your codebase you write using ORM syntax that looks nothing like that raw SQL.
For those who haven't dealt with an ORM before, think of it this way: you write a message in English, and there's an "auto-translator" that converts it to Japanese before sending it to the recipient. One day there's a problem with the delivered message — but you can only see the Japanese version. Finding which part of your original English text caused the translation issue? That's the kind of effort that makes you want to go back to bed.
Now with Kiro, I just provide the raw query + codebase access, and it automatically finds which part of the code generates that problematic query. What used to take days now finishes in hours — and that's just the investigation phase, not even the fix.
How I Got Access to Kiro
I've been actively using Kiro at work lately. Earlier last year, our company received credits through the Kiro for Startup program, so we figured we'd make the most of it.
Besides debugging and exploring queries on MS SQL Server, I sometimes use Kiro to analyze AWS CloudWatch logs — while providing application context so the analysis is more accurate and not generic.
In this post, I want to share how I've been using Kiro as a partner over the past few weeks to improve query performance in our .NET Core application. Why "partner"? Because Kiro isn't allowed direct access to the database — it has to go through me. We discuss, collaborate, and solve together. It's not an AI that gets handed a button and told to run on its own.
When the Database Started Screaming
A while back, our database metrics showed alarms — data I/O was spiking frequently. This needed to be investigated and improved before users started feeling the impact.
Like I said earlier — this was the work I dreaded the most. The complexity is at the level of: you only get raw queries generated by the ORM, while in the codebase you write using syntax that looks completely different. You can't immediately tell which code is generating the slow query.
For a simpler picture: an ORM is like telling an assistant "get me the active orders, sorted by most recent." The assistant translates that instruction into technical commands for the database. If their translation turns out to be inefficient and makes the database slow, you have to reverse-engineer from that technical output back to your original instruction — and that's what makes it painful.
The Flow: Kiro Can't Touch the Database
Since the database can't be given direct access to AI, the flow works like this: Kiro tells me what queries to run, I execute them on the database, and I send the results back for analysis.
I started by giving context:
"I have an MS SQL Server database that spiked in data I/O a few minutes ago. We're going to find out which process/query caused this. Tell me what queries I need to run, I'll execute them and send you the results to analyze."
From there, Kiro gave me several diagnostic queries to run:
Top I/O queries — queries with the highest physical reads/writes
Currently running I/O heavy — queries running during the spike
I/O stats per database file — which files have the most I/O
I/O wait stats — dominant I/O-related wait types
Current indexes — all existing indexes in the database
Index usage stats — how often indexes are used vs updated
Missing indexes — index recommendations from SQL Server itself
Index fragmentation — fragmented indexes can cause excessive I/O
Resource stats — historical resource usage (Azure-specific)
I/O stats per table — which tables produce the most I/O
After I ran everything and sent the results, Kiro immediately analyzed and delivered a comprehensive output — from executive summary to action plans by priority.
The Analysis: Not Just "Your Query is Slow"
Kiro provided findings with severity levels:
| Finding | Severity |
|---|---|
| Very high read latency (130-169ms avg) | 🔴 Critical |
| 86% wait time = PAGEIOLATCH_SH (read I/O | 🔴 Critical |
| Missing index on primary filter columns | 🔴 Critical |
| 3 indexes never read (0 reads, 24K+ writes) | 🟡 Warning |
| Eager loading before pagination in ORM | 🔴 Critical |
What's interesting is it didn't stop at the database level. It immediately identified the problematic code pattern:
csharp
// Problematic pattern found by Kiro:
var data = _db.Orders
    .Include(a => a.OrderItems)      // ← Eager loads ALL items first
    .AsNoTracking()
    .Where(x => x.TenantId == tenantId && !x.Deleted)
    .OrderByDescending(x => x.UpdatedAt)
    .Skip(page * size)
    .Take(size)
    .ToListAsync();
For non-.NET developers: .Include() is like saying "also grab all the related data while you're at it." The problem is it's placed before pagination — meaning the database loads all data plus all its relations into memory first, then cuts it per page. If there are millions of rows? Out of Memory.
Kiro recommended a 2-step fix approach:
csharp
// Step 1: Get just the IDs first (lightweight, no relations)
var pagedIds = await _db.Orders
    .Where(x => x.TenantId == tenantId && !x.Deleted)
    .OrderByDescending(x => x.UpdatedAt)
    .Skip(page * size)
    .Take(size)
    .Select(x => x.Id)
    .ToListAsync();

// Step 2: Load full data + relations only for the paged IDs
var result = await _db.Orders
    .Include(a => a.OrderItems)
    .AsNoTracking()
    .Where(x => pagedIds.Contains(x.Id))
    .ToListAsync();
The concept is universal: don't load everything first then cut — cut first, then load what's needed. This applies to any framework or language that has an ORM.
Besides code-level fixes, Kiro also provided database-level action plans:
Create missing index for columns frequently filtered but not yet indexed
Drop unused indexes that are never read but constantly updated on every write (cost without benefit)
Disable Azure auto-index which sometimes creates overhead by generating indexes that end up useless
Why the Results Are Different from Just Pasting a Query into AI
Looking at the action plan above, Kiro doesn't just analyze slow raw queries and give generic advice like "add an index." What makes the difference: it also studies the .NET Core backend code that generates those queries.
So for example, from a slow raw query, it can trace on its own — "Oh, this query is generated from OrderController.GetDataTableParams, line such-and-such, in repository method GetOrdersWithDateFilter." I don't need to tell it which file — it searches the codebase itself.
From there, the suggestions become specific to our situation, not template answers:
Queries that need tuning aren't just from the SQL side, but also from how the ORM generates them. For example, the
.Include()positioning that causes the database to load millions of rows before pagination kicks in — that's a code-level refactor suggestion, not a database-level one.There's an Azure feature that turned out to be counter-productive in our setup: auto-index was active but kept creating indexes that were never read, adding ~47K write cost updates with zero benefit.
The indexes it suggested dropping weren't guesses. It cross-checked from usage stats (0 reads, tens of thousands of writes) and confirmed that no query in the codebase actually needs those indexes.
This is what's different from just giving a single query snippet to AI and asking for opinions. Because Kiro has access to the entire codebase, it can connect the dots — from "slow query in the database" to "the code pattern in the application that generates that query" — and provide solutions that address both sides simultaneously.
AI Doesn't Make You Dumber — It Became a Learning Partner
Something I hear often: "AI makes us dumber and lazier to learn." My experience in this case was the exact opposite.
Here's what happened. When Kiro found problematic patterns in the codebase, it didn't just say "this is wrong, change it to this." It explained why it's wrong, what happens behind the scenes, and when that pattern is actually acceptable. And me — someone who's been writing .NET code for years — only then realized some fundamental things I'd been overlooking.
What makes this a "learning partner" rather than just a smart autocomplete: every time Kiro found something interesting, I asked it to explain in more detail and save it as a separate markdown file. I titled them like learning notes — "What I Learned Today: Why .ToLower() in LINQ Queries Makes the Database Slow."
Those files I then generated into PDFs and shared to the team's Slack. So it wasn't just me learning — the whole team got the insights too.
Here are some examples of what I learned from this process:
.ToLower() in ORM Queries Actually Makes the Database Slow
Kiro found this pattern scattered across many repositories:
csharp
// ❌ Makes the index unusable
db.Products.Any(x => x.Code.ToLower() == code.ToLower());
Why is it problematic? The ORM translates .ToLower() into the LOWER() function in SQL. When a function is applied to a database column in a WHERE clause, the index becomes unusable — SQL Server has to scan every row one by one.
On a table with 1.6 million rows: what should take < 1 millisecond becomes 2-5 seconds. And in our case, this function was called ~2,400 times in 6 hours. That's 2,400 full table scans that shouldn't have been necessary.
Turns out our database uses Case Insensitive (CI) collation — meaning string comparisons are already automatically case-insensitive without needing any function:
csharp
// ✅ Index is used, same result because DB collation is already CI
db.Products.Any(x => x.Code == code);
What Kiro explained that gave me that "ohhh" moment was the context difference: if the query goes to the database (LINQ-to-SQL), .ToLower() isn't needed because collation handles it. But if data is already loaded into memory (LINQ-to-Objects), .ToLower() or StringComparison.OrdinalIgnoreCase is still required because C# is case-sensitive by default. Same syntax, completely different behavior depending on context. Years of writing LINQ and this was the first time I truly understood the difference.
An OR Condition That Was Actually Redundant
This pattern was found in the mobile sync feature:
csharp
// ❌ Redundant and makes the index suboptimal
.Where(a => a.UpdatedAt >= param || a.CreatedAt >= param)
Two problems
ORacross two different columns makes the database unable to use indexes efficiently — it has to scan two separate ranges then merge the resultsThe
CreatedAtcondition is redundant — because in our application logic, every time a new record is created,UpdatedAtis set equal toCreatedAt. And every time it's updated, onlyUpdatedAtchanges. SoUpdatedAtis always >=CreatedAt
What made this a learning moment: Kiro didn't just say "remove the OR." It traced to SaveChangesHelper in the codebase, showed the logic — that in our entity lifecycle, UpdatedAt is always set alongside CreatedAt on insert, and only UpdatedAt changes on update. So mathematically, that OR condition never adds any additional results.
Just use
csharp
// ✅ Single condition, optimal index usage
.Where(a => a.UpdatedAt >= param)
And there are several other things I learned — enough that I'll probably need to split them into a separate article later.
The point is: as long as you can prompt properly and have the curiosity to ask "why?", AI actually becomes an accelerator for learning. It's not a replacement for thinking — it's a door opener to things you didn't even know existed. And if you diligently save those insights, one learning session can become knowledge sharing for an entire team.
A Successful Discussion Is Too Valuable to Throw Away — Make It a Workflow
This is the part I find most impactful.
After a long discussion — going back and forth sending queries, receiving analysis, discussing solutions — I started to realize: "The pattern is established. If another database spikes tomorrow, am I going to start from scratch again?"
So I asked Kiro: from today's discussion, formalize this into something reusable.
Specifically:
The diagnostic queries from earlier, save them to a
sql-audit/folder — separated per file by purposeCreate a prompt template that can be used directly without repeating the discussion from scratch
And Kiro executed immediately. The results:
sql-audit/ folder — all diagnostic queries organized neatly per file in investigation order. Going forward, when there's an I/O problem, no need to think "where do I start?" — just open the folder, run them one by one.
| # | File | Purpose |
|---|---|---|
| 1 | 01_top_io_queries.sql | Top historical I/O-causing queries |
| 2 | 02_currently_running_io_heavy.sql | Queries running during spike |
| 3 | 03_io_stats_per_database_file.sql | Latency per database file |
| 4 | 04_io_wait_stats.sql | Dominant I/O wait types |
| 5 | 05_current_indexes.sql | Review all indexes |
| 6 | 06_index_usage_stats.sql | Index used or wasted |
| 7 | 07_missing_indexes.sql | SQL Server index recommendations |
| 8 | 08_index_physical_stats.sql | Index fragmentation |
| 9 | 09_azure_resource_stats.sql | Resource usage (Azure) |
| 10 | 10_io_per_table.sql | Tables with highest I/O |
Prompt Template (db-query-optimization-prompt.md) — complete instructions: what Kiro should analyze, expected output format, severity classification, and action plans to generate. Basically an "SOP" that's ready to invoke.
Now when there's a database spike, my flow is literally just:
```
Using the prompt below, please analyze this database's performance results.

Prompt file: query-optimization/db-query-optimization-prompt.md
Latest SQL audit results: /sql-audit
```
Done. No long discussions. No "what did we talk about last time?" Everything is already encoded in the template.
The takeaway: a long discussion with AI is valuable, but it's even more valuable if you convert the results into a reusable checkpoint. Many people use AI but let the knowledge from discussions just vanish — chat closes, gone. When you could have asked the AI to formalize it into a prompt template, a structured folder, or a workflow that runs without prior context.
What If I Want to Continue Tomorrow But the Chat is Gone?
One more problem that surfaced early on: how do you continue progress across days?
For example, on the 13th we found issues and applied fixes. But it takes several days to see the impact. When I wanted to continue the discussion on the 15th or 28th, the previous chat was already closed and hard to find.
The solution is simple: after every analysis session, ask Kiro to save the results to a file with a date format:
query-optimization/orders-db/2026-05-13_initial_analysis.mdquery-optimization/orders-db/2026-05-28_follow_up_review.md
Everything is recorded: findings, suggestions, what's been fixed, what hasn't, reasoning behind every decision. Including things like "on the 13th Kiro suggested creating index X, but in the follow-up on the 28th asked to drop it because after code refactoring it was no longer effective."
So the next prompt is simply:
Analyze this database's performance results.
- Prompt file: db-query-optimization-prompt.md
- Latest SQL audit results: /sql-audit
- Previous discussion context: query-optimization/orders-db/
Kiro immediately has full context. The discussion is continuous, building on previous sessions, and the AI gets a broad picture without needing everything re-explained from zero every new session.
The Unexpected Part: Audit Notes Became a Code Review Guard
What I didn't expect — that change log folder ended up having a second life. It's now part of our code review automation.
One of the rules in our code review skill agent:
"Ensure code changes follow best practices and avoid mistakes that have been made before — the data is in the
query-optimization/folder. Ensure every new change is optimal from both query and index perspectives."
So when AI performs code review on a developer's pull request, it also cross-checks against the history of past mistakes. The feedback loop is closed — the same mistakes are minimized without relying on human memory.
What started as just "debug a database spike" now became:
Investigation tool — sql-audit folder for quick diagnostics
Knowledge base — new insights shared with the team
Reusable workflow — prompt template ready to use
Continuous context — change log as cross-session memory
Prevention mechanism — code review guard from historical mistakes
One problem, five outputs. Not planned from the beginning — but because each step was made reusable, the dominoes fell on their own.
That's it for this time. Kiro doesn't just make work faster — it makes the learning process more structured, workflows more repeatable, and knowledge doesn't disappear into a closed chat window.
It's not the database that gets tired. It's the humans who have to repeat the same process over and over without a system.
See you in the next post. 🙌
Join the conversation! Your thoughts help the community grow.