

Phase 01 — System Design Fundamentals | Topic 10
Your API can have clean code, proper architecture, and a powerful server, but users can still complain:
“This API is too slow.”
At that point, one of the worst things a developer can do is immediately start changing random pieces of code.
An API response may be slow because of the network, application processing, database queries, an external API, or a combination of all of them.
To improve performance, we first need to understand where the time is being spent.
That is where latency becomes important in System Design.
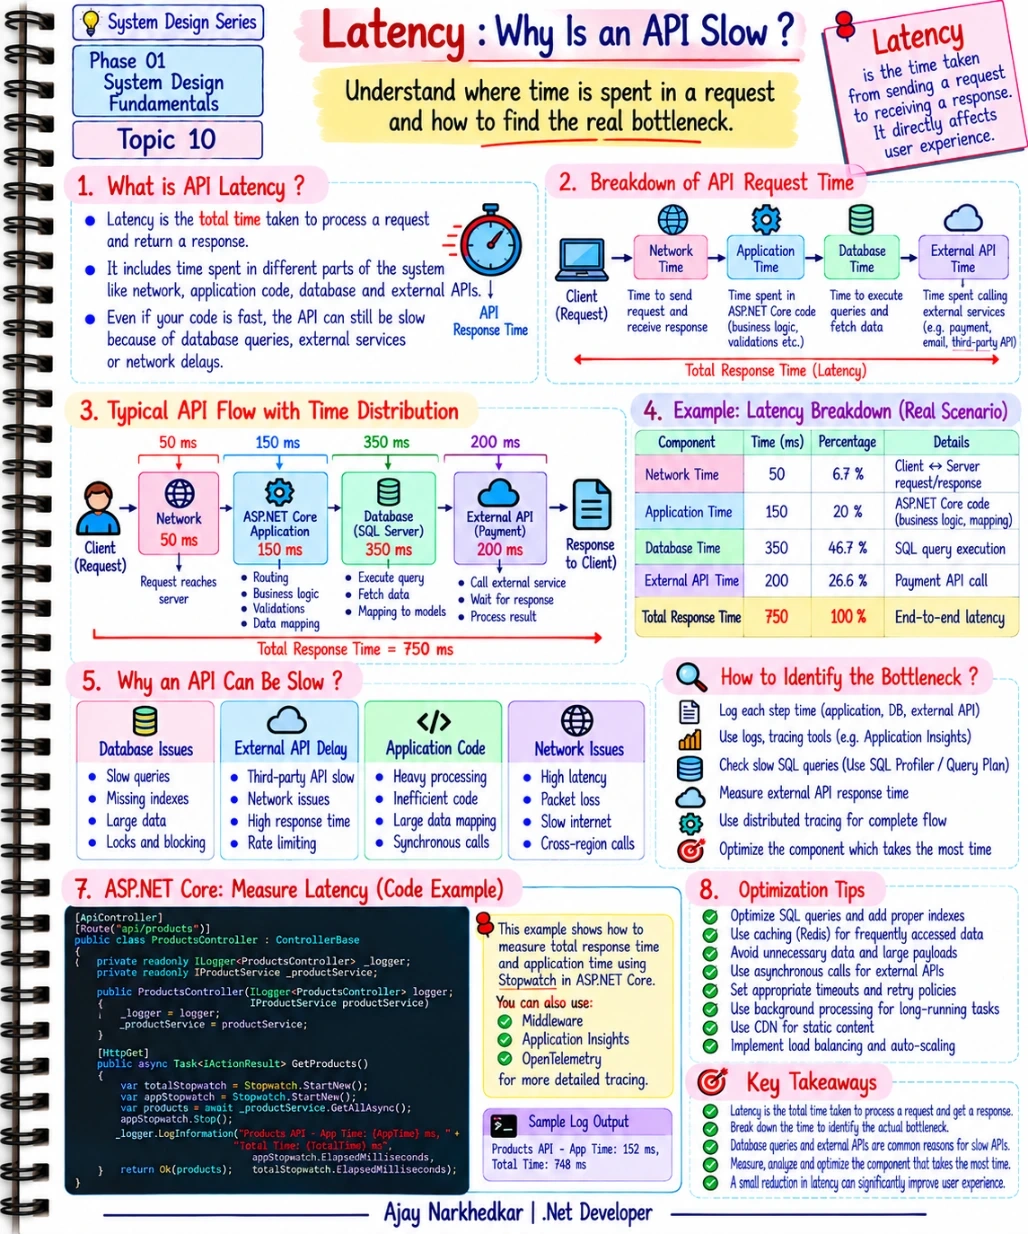
What Is API Latency?
Latency is the amount of time taken by a request from the moment it is sent until the response is received.
For an ASP.NET Core API, the total response time can include several different parts of the system.
A simplified view looks like this:
Client
   ↓
Network
   ↓
ASP.NET Core Application
   ↓
Database
   ↓
External API
   ↓
Response
The user experiences all of that as a single number.
For example, the API may appear to take:
750 milliseconds
But those 750 milliseconds may actually be made up of:
50 ms of network time
150 ms of application processing
350 ms of database processing
200 ms of external API processing
The important question is therefore not simply:
“Why is the API slow?”
The better question is:
“Which part of the request is consuming most of the time?”
Total Response Time Is Made of Multiple Parts
A useful mental model is:
Total Response Time
=
Network Time
+
Application Time
+
Database Time
+
External Service Time
+
Other Processing Time
This is a simplified model, but it is very useful when starting a performance investigation.
For example, imagine the following request:
GET /api/products
The request reaches the ASP.NET Core application.
The application validates the request and executes business logic.
It then queries SQL Server for product data.
After that, it calls an external service to retrieve some additional information.
Finally, it creates the response and sends it back to the client.
Even if the controller itself executes quickly, the complete API can still be slow.
Understanding the Request Flow
Let's take a practical example.
Suppose an Order API takes 750 ms to respond.
We measure each stage and find:
Network             50 ms
ASP.NET Core        150 ms
SQL Server          350 ms
External API        200 ms
---------------------------
Total               750 ms
Now we know something useful.
The database is taking the most time.
That tells us where to investigate first.
We should not randomly optimize the controller if the database is responsible for nearly half of the total response time.
This is one of the most important performance habits for backend developers:
Measure first. Optimize second.
Where Can API Latency Come From?
API latency can come from several areas.
Network Latency
Network latency represents the time involved in sending the request to the server and returning the response.
This can be affected by the physical distance between systems, routing, network congestion, cross-region communication, and other infrastructure conditions.
For applications deployed across multiple regions, calling a service in another region can introduce additional delay.
For example, an API hosted in India calling a service hosted in another geographic region may experience more network latency than communicating with a nearby service.
Network latency is especially important in distributed systems because a single user request may involve multiple service-to-service calls.
Application Processing Time
Application time is the time spent executing your ASP.NET Core code.
This can include:
Request validation
Authentication and authorization
Business logic
Object mapping
Data transformation
Serialization
Complex calculations
Calling other services
For example, an API may become slow because it performs unnecessary processing before returning a response.
Consider code that loads thousands of records and then performs expensive processing in memory.
The database might be fast, but the application itself can still introduce significant latency.
This is why developers should measure both database time and application time instead of assuming that the database is always the problem.
Database Latency
Database operations are one of the most common causes of slow APIs.
A query may take only a few milliseconds in development but become much slower when the production database contains millions of records.
Common causes include:
Inefficient SQL queries
Missing indexes
Returning more data than required
Large joins
Repeated queries
Locking and blocking
Poor execution plans
N+1 query problems
For example, consider:
var orders = await _context.Orders
    .ToListAsync();
This may be fine for a small table.
But if the table contains millions of records, retrieving everything is obviously not a good approach.
A better design might use pagination and projection:
var orders = await _context.Orders
    .AsNoTracking()
    .Select(o => new OrderDto
    {
        Id = o.Id,
        Status = o.Status,
        TotalAmount = o.TotalAmount
    })
    .Skip((page - 1) * pageSize)
    .Take(pageSize)
    .ToListAsync();
Now the application requests only the required data.
This can reduce database work, network payload size, and application processing.
External API Latency
Modern applications rarely work alone.
Your ASP.NET Core API may need to call:
Payment providers
Email services
Shipping services
Authentication providers
Third-party APIs
Internal microservices
Suppose your API takes 100 ms by itself.
Then it calls an external payment service that takes 800 ms.
Your user may now wait close to 900 ms or more for the response.
This means your application's performance is also influenced by the systems it depends on.
That creates an important System Design question:
What happens if the external service becomes slow or unavailable?
Later in the series, this will connect directly to topics such as timeouts, retries, circuit breakers, and fallback strategies.
A Real Latency Breakdown
Let's take a realistic example.
Suppose an Order API produces the following measurements:
Component | Time |
|---|---|
Network | 50 ms |
ASP.NET Core application | 150 ms |
SQL Server | 350 ms |
Payment API | 200 ms |
Total | 750 ms |
The database is responsible for the largest portion of the response time.
That immediately gives us a direction for investigation.
We can check:
The SQL query.
The execution plan.
Existing indexes.
The amount of data being returned.
Whether the query is being executed multiple times.
Whether blocking or locking is occurring.
The important idea is that profiling gives direction.
Without measurement, developers often optimize the wrong component.
How Do You Find the Bottleneck?
When an API is slow, your first job is to break the request into measurable components.
For example, you can measure:
Request received
        ↓
Application starts
        ↓
Database call starts
        ↓
Database call finishes
        ↓
External API starts
        ↓
External API finishes
        ↓
Response returned
Once you have these timings, you can identify the slowest stage.
For a .NET application, you can use tools and techniques such as:
Application logs
These help you record how long important operations take.
SQL execution plans and profiling
These help you investigate slow database queries.
Application Insights
This can help you understand request duration, dependencies, failures, and performance trends in Azure environments.
Distributed tracing
This becomes especially valuable when one request passes through multiple services.
OpenTelemetry
It can help collect traces, metrics, and other observability data across distributed applications.
The tool is not the main point.
The important part is having enough visibility to answer:
“Where is the time going?”
Measuring Latency in ASP.NET Core
Let's create a simple example using Stopwatch.
[ApiController]
[Route("api/products")]
public class ProductsController : ControllerBase
{
    private readonly IProductService _productService;
    private readonly ILogger<ProductsController> _logger;

    public ProductsController(
        IProductService productService,
        ILogger<ProductsController> logger)
    {
        _productService = productService;
        _logger = logger;
    }

    [HttpGet]
    public async Task<IActionResult> GetProducts()
    {
        // Start measuring the complete API execution time.
        var totalStopwatch = Stopwatch.StartNew();

        // Measure only the application/service operation.
        var appStopwatch = Stopwatch.StartNew();

        var products = await _productService.GetProductsAsync();

        appStopwatch.Stop();
        totalStopwatch.Stop();

        _logger.LogInformation(
            "Products API - App Time: {AppTime} ms, Total Time: {TotalTime} ms",
            appStopwatch.ElapsedMilliseconds,
            totalStopwatch.ElapsedMilliseconds);

        return Ok(products);
    }
}
This is a simple example, but it demonstrates an important idea.
We are not simply saying:
“The API feels slow.”
We are collecting actual measurements.
In a production application, you would normally use structured logging, middleware, tracing, Application Insights, OpenTelemetry, or another observability approach instead of manually timing every controller method.
Why Database Time and Total Time Are Different
This is an important distinction.
Suppose your database query takes:
300 ms
but your API takes:
700 ms
Then the database is not responsible for all of the latency.
The remaining time may come from:
Application processing
Network communication
Serialization
External API calls
Other internal operations
On the other hand, if the database takes:
650 ms
and the API takes:
700 ms
then the database is a very strong candidate for the primary bottleneck.
This is why individual timings are valuable.
A Slow API Does Not Always Mean Slow Code
This is one of the most common misunderstandings.
A developer may look at the controller and say:
“The C# code is simple, so the API should be fast.”
Not necessarily.
Your C# code may execute in 20 ms while the database takes 500 ms.
Or your application may spend 50 ms processing the request while an external API takes 1 second.
The system is experienced by the user as one complete request.
Therefore:
System performance must be analyzed end to end.
Common Reasons for High API Latency
A slow API can have many causes.
A database query may be inefficient or missing the right index.
An external service may have high response times.
Application code may perform unnecessary calculations or process too much data.
The API may return a very large response payload.
Network communication may be introducing additional delay.
In distributed systems, too many sequential service-to-service calls can also increase latency.
The right solution depends on the actual bottleneck.
How Can We Reduce Latency?
Once we know which component is slow, we can optimize that component.
If the database is slow, we may improve query performance, add or modify indexes, reduce unnecessary data retrieval, or introduce caching where appropriate.
If an external API is slow, we may introduce timeouts, asynchronous processing, caching, batching, or other architectural approaches depending on the business requirement.
If application processing is slow, we may simplify expensive operations, reduce unnecessary mapping, improve algorithms, or move long-running work to background processing.
If network latency is significant, we may reconsider service locations, reduce unnecessary service calls, or minimize the amount of data transferred.
The key principle remains the same:
Do not optimize based on assumptions. Optimize based on measurements.
Latency and User Experience
Latency is not only a technical measurement.
It directly affects the user experience.
Imagine two applications with exactly the same features.
One responds quickly.
The other takes several seconds for every action.
From the user's perspective, they are very different products.
This is why performance requirements are part of System Design and not simply something that developers think about after the application is finished.
A business may define a requirement such as:
“Most API requests should complete within an acceptable response time.”
That requirement can influence architecture, database design, caching, infrastructure, and monitoring decisions.
Latency vs Throughput
Latency and throughput are related, but they are not the same.
Latency measures how long one request takes.
Throughput measures how much work the system can handle over a period of time.
For example, an API may have:
200 ms latency
and still support:
1,000 requests per second
depending on the architecture.
A system can therefore have good throughput but poor latency, or good latency at low traffic but poor throughput under heavy load.
This is why System Design considers multiple performance dimensions instead of relying on a single number.
A Simple Way to Investigate a Slow API
When someone reports:
“The API is slow.”
Don't immediately rewrite the code.
Start by asking:
What is the total response time?
Then determine:
How much time is spent in the application?
How much time is spent in the database?
How much time is spent waiting for external services?
Is network communication adding significant delay?
Is the problem happening for every request or only under higher traffic?
Once these questions are answered, the optimization path becomes much clearer.
IMPORTANT Takeaway
Latency is not simply about whether your C# code is fast.
An API request can spend time in several places:
Network + Application + Database + External Services + Other Processing
The total of these delays determines the response time experienced by the user.
So when an API becomes slow, don't start with:
“Which line of C# should I optimize?”
Start with:
“Where is the time being spent?”
Measure the request, identify the bottleneck, and then optimize the component responsible for the delay.
That is a much more reliable way to approach API performance.
Final Thoughts
As .NET developers, we spend a lot of time writing controllers, services, database queries, and APIs.
But System Design requires us to look beyond individual classes and methods.
When a request enters the system, it travels through multiple components before the user receives a response.
Understanding that complete journey helps us diagnose performance problems more accurately.
The goal is not simply to make one method faster.
The goal is to make the whole system respond efficiently and consistently.
What's Next?
We now understand latency and the different components that contribute to response time.
But performance is only one part of a production system.
The next question is:
What happens when something goes down?
Phase 01 — System Design Fundamentals | Topic 11 — Availability: What Happens When Something Goes Down?
We will explore what availability means, why downtime matters, and how system design can help applications remain available when individual components fail.
Join the conversation! Your thoughts help the community grow.