

Introduction
R is an important programming language used heavily by statisticians. It is also used in machine learning, data science, research, and many more new fields. It is a computing environment where statistical data may be implemented.
In a previous article, we learned how to add two matrices in R. In this article, we shall learn the multiplication between two matrices in R. Apart from this, we shall also learn the major difference between two important operators in R, which are * and %*%.
Let's get started now.
Operators * And %*% In R
The * operator is a simple arithmetic operator. It is called the multiplication operator. The %*% operator is a special kind of multiplication operator. It is used in the multiplication of matrices in R. Now, we shall see how these two work differently, with examples. To see the differences between these two operators, we shall use both operators with two numbers separately.
- #Using Simple Multiplication Operator
- 2 * 2
> 2 * 2
[1] 4
As shown above, we have used a simple multiplication operator (*). Now, we shall use a matrix multiplication operator %*% with the same values as above.
- #Using Matrix Multiplication Operator
- 2%*%2
> 2%*%2
[,1]
[1,] 4
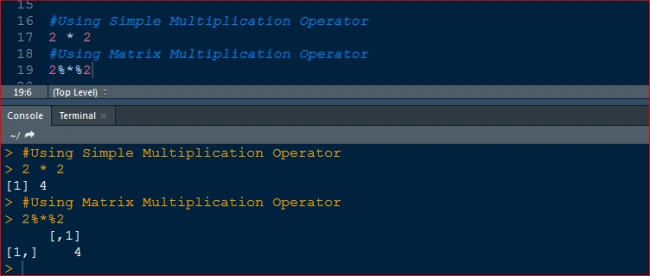
Now, we can see the differences clearly as with both operators, the operands are the same but the outputs are different. In a simple multiplication operator (*), the output has been generated as a vector while in the matrix multiplication operator, the output has been generated as a matrix of one row and one column. It has been shown by the below image in R studio on how it works.
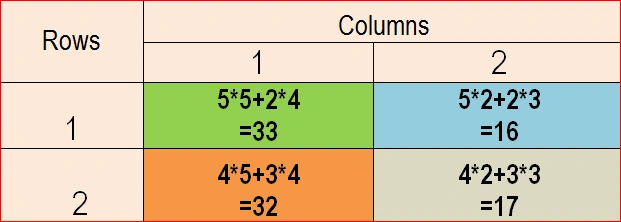
Now, we shall see and learn in detail how matrix multiplication works in R using matrix multiplication operator which is %*%.
Creating Matrices For Multiplication
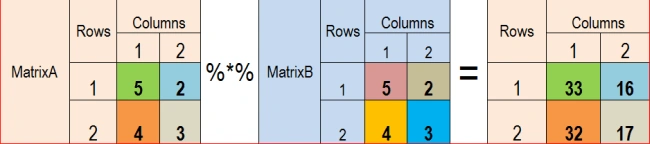
Let's first understand the problem statement in the following image where we have to find the output after multiplying MatrixA and MatrixB.

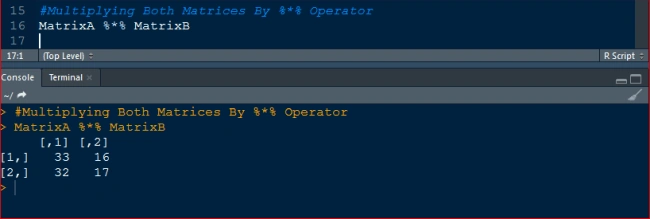
As we can see in the above image, both matrices are of the same dimensions and the same elements. So, to work with that, first, we shall create a matrix in R. It has been created using the below R script in R Studio.
Esteban AngelPosted Jul 23, 2020, 1:23 PM
Is there any way to output the illustrated image in R, to show step by step for a class example
Abhishek MishraPosted Oct 24, 2018, 9:52 AM
Well articulated