

Introduction
For many years, Microsoft Excel with Power Pivot has been the go-to analytics solution for business users, analysts, and finance teams. It empowered users to build data models, create relationships, write DAX calculations, and generate interactive reports—all within a familiar spreadsheet environment.
However, as organizations scale, Excel-based analytics often begin to show limitations:
Multiple versions of the same workbook
Lack of centralized governance
Difficulty sharing reports securely
Performance bottlenecks with large datasets
Manual refresh dependencies
This is where Power BI becomes the natural evolution.
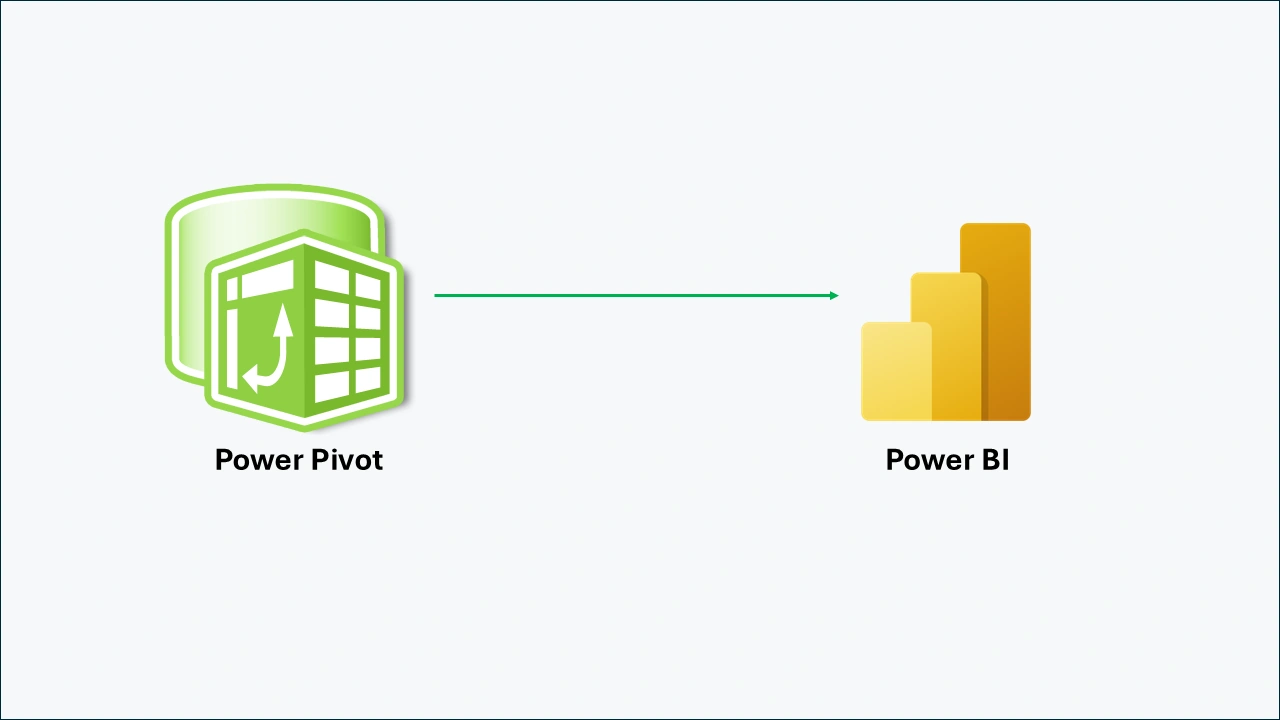
Power BI extends the capabilities of Power Pivot into a modern enterprise analytics platform—offering centralized semantic models, scalable cloud deployment, interactive dashboards, governance, and seamless integration with Microsoft Fabric.
This article explores how to successfully migrate from Power Pivot in Excel to Power BI.
Why Move from Power Pivot to Power BI?
Organizations are increasingly standardizing on Power BI because it provides:
1. Centralized Semantic Models
Instead of multiple Excel files living on desktops, datasets are published and governed centrally.
2. Better Collaboration
Reports and dashboards can be shared securely across teams and departments.
3. Enterprise Governance
Features like row-level security (RLS), workspace permissions, lineage, and auditing become possible.
4. Scalability
Power BI handles significantly larger datasets than Excel.
5. Real-Time Refresh
Automated scheduled refresh and streaming data support.
6. Fabric Integration
Native support for:
Lakehouse
Warehouse
Data Factory
Dataflows Gen2
Real-Time Intelligence
What Can Be Migrated?
A common misconception is that everything in Excel automatically migrates.
Components That Usually Migrate Successfully
✅ Power Pivot data model tables
✅ Relationships
✅ DAX measures
✅ KPIs
✅ Power Query (M transformations)
✅ Some Power View visuals
What Does NOT Migrate Automatically?
❌ Excel worksheet formatting
❌ Pivot tables
❌ Pivot charts
❌ VBA macros
❌ Excel formulas outside Power Pivot
❌ Conditional formatting rules
❌ Slicer layouts
These typically need rebuilding inside Power BI.
Migration Architecture
Excel Workbook
(Power Pivot + Power Query)
        │
        ▼
Import Workbook into Power BI Desktop
        │
        ▼
Validate Semantic Model
        │
        ▼
Rebuild Reports & Dashboards
        │
        ▼
Publish to Power BI Service
        │
        ▼
Govern & Scale with Microsoft Fabric
Step-by-Step Migration Approach
Step 1: Inventory Your Existing Excel Solution
Document:
number of workbooks
data sources
refresh logic
DAX measures
report dependencies
Step 2: Assess Complexity
Ask:
Are macros heavily used?
Are there linked workbooks?
How many pivot tables exist?
Is manual data entry involved?
Step 3: Import Workbook into Power BI
Power BI supports direct import of Excel models.
This usually brings:
tables
relationships
Power Query steps
measures
Step 4: Validate DAX Logic
Some measures may behave differently due to:
filter context
visual context
relationship behavior
Test every KPI.
Step 5: Rebuild Visuals
Replace:
Pivot Tables → Matrix visuals
Excel Charts → Power BI visuals
Slicers → Power BI slicers
Power BI adds:
drillthrough
bookmarks
tooltips
cross-filtering
Step 6: Publish and Schedule Refresh
Move refresh from manual Excel refreshes to automated cloud refreshes.
Benefits:
no user dependency
consistent datasets
reliable delivery
Common Migration Challenges
1. Hidden Business Logic
Often business rules are buried in Excel formulas.
Recommendation:
Document everything first.
2. DAX Differences
Power Pivot DAX and Power BI DAX are similar—but visuals can change results.
Always validate totals.
3. User Resistance
Many users love Excel.
Best practice:
Use Analyze in Excel so users can still consume Power BI datasets inside Excel.
Best Practices
✔ Start with a pilot workbook
✔ Prioritize high-value reports first
✔ Standardize naming conventions
✔ Create reusable semantic models
✔ Train users early
✔ Establish governance from day one
Role of Microsoft Fabric
After migration, extend Power BI with Fabric:
Store raw data in Lakehouse
Use Data Factory pipelines
Build medallion architecture
Enable AI workloads
Centralize enterprise analytics
This transforms reporting into a modern data platform.
Business Benefits
Organizations that migrate typically gain:
faster reporting
improved trust in data
lower maintenance
stronger governance
better collaboration
future-ready analytics
Conclusion
Migrating from Power Pivot in Excel to Power BI is not simply a technology upgrade—it is a strategic move toward a governed, scalable, and modern analytics ecosystem.
Excel still has an important role for ad hoc analysis and power users, but Power BI should become the organization’s central reporting platform.
The most successful migrations start small, validate thoroughly, and scale deliberately.
Your Excel models already contain valuable business logic—Power BI helps unlock that value at enterprise scale.
Join the conversation! Your thoughts help the community grow.