Microsoft Fabric continues to improve how administrators monitor and manage capacity usage across their organisation. The new Fabric Capacity Monitoring experience provides a centralised view of capacity health, making it easier to identify capacity issues, monitor resource consumption, and manage Fabric capacities from a single interface.
In this article, we will explore the new Capacity Monitoring experience, the information displayed on the monitoring page, and how administrators can use it to manage their capacities effectively.
Accessing Fabric Capacity Monitoring
To access the monitoring experience, sign in to the Microsoft Fabric portal and select Monitor from the left navigation pane. Under the Monitoring section, select Activities to access the monitoring interface.
From there, you can navigate to the Manage Capacities page, where you can view and manage the capacities available within your tenant.
Understanding the Manage Capacities Page
The Manage Capacities page provides an overview of your Fabric capacities through a dashboard-style layout. Rather than relying solely on individual capacity settings, administrators can view the health status of multiple capacities in one place.
The page displays the following key information:
- Total Capacities: Shows the total number of capacities available in the tenant.
- Healthy: Displays the number of capacities currently reporting a healthy status.
- At Risk: Identifies capacities that may be experiencing issues requiring attention.
- Degraded: Shows capacities whose health status indicates degraded performance or service.
- Paused: Displays the number of capacities that are paused.
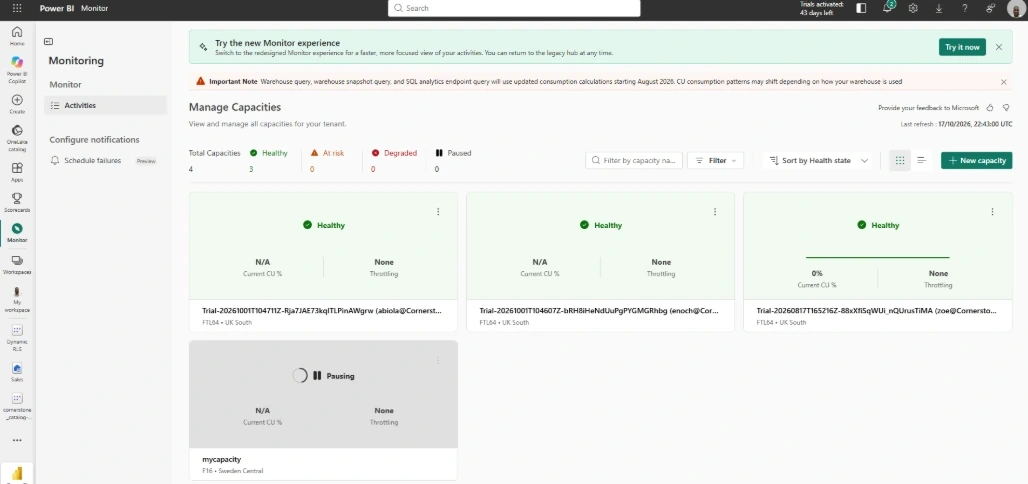
In the screenshot, four capacities are listed. Three are marked as Healthy, while the fourth capacity, named mycapacity, is in the process of pausing.
These status indicators give administrators a quick overview of their capacity environment without having to inspect every capacity individually.
Monitoring Individual Capacities
Each capacity is displayed as a separate card containing useful information about its current state.
The cards in the screenshot display the following details:
1. Capacity health status
The health indicator shows whether a capacity is healthy or in another state, such as pausing. This helps administrators identify capacities that may need further investigation.
2. Current CU percentage
The Current CU % metric provides information about capacity unit utilisation. Capacity Units (CUs) represent the computational resources available to a Fabric capacity.
Monitoring CU consumption helps administrators understand how heavily a capacity is being used. In the screenshot, the displayed values are either N/A or 0%. These values should be interpreted in the context of the current reporting state and available monitoring data rather than assumed to represent typical consumption.
3. Throttling
The throttling indicator provides visibility into whether capacity throttling is being reported. The displayed capacities show None, meaning no throttling is indicated in the snapshot.
Monitoring this information is useful because sustained capacity pressure can affect the performance and responsiveness of workloads running on Microsoft Fabric.
4. Capacity SKU and region
Each card also displays the capacity SKU and its associated Azure region. For example, the screenshot shows several FTL64 capacities in UK South and an F16 capacity in Sweden Central.
This information helps administrators identify the capacity size and region associated with each resource.
Filtering and Sorting Capacities
When an organisation has multiple Fabric capacities, finding a specific capacity can become challenging. The Manage Capacities page provides tools to make this easier.
Administrators can use the available controls to:
- Search for a capacity by name.
- Apply filters to narrow down the displayed capacities.
- Sort capacities by health state.
- Switch between the available card and list views.
These features are particularly useful for organisations managing several workspaces, teams, or workloads across different capacities.
Creating a New Fabric Capacity
The page also includes a + New capacity button, allowing authorised users to start the process of creating a new capacity.
This provides a convenient entry point for organisations that need additional Fabric resources to support new projects, larger workloads, or growing analytical requirements.
The ability to create a capacity depends on the user's permissions and the organisation's available purchasing and provisioning options.
The New Monitor Experience
The screenshot also includes a notification inviting users to try the redesigned Monitor experience.
This new experience is intended to provide a faster, more focused view of activities. Users can select Try it now to explore the redesigned interface, while the notification indicates that they can return to the legacy hub when needed.
As Microsoft Fabric continues to evolve, becoming familiar with the newer monitoring interfaces can help administrators make better use of the platform's management capabilities.
Important Note on Capacity Consumption
The screenshot includes a notice explaining that warehouse queries, warehouse snapshot queries, and SQL analytics endpoint queries will use updated consumption calculations starting in August 2026.
Because capacity consumption calculations can affect how usage is interpreted, administrators should review Microsoft's latest documentation when analysing CU consumption, investigating workload patterns, or planning capacity requirements.
Conclusion
The new Fabric Capacity Monitoring experience provides administrators with a convenient way to review capacity health, inspect individual capacities, check utilisation and throttling indicators, and manage resources across their tenant.
By regularly reviewing the Manage Capacities page, administrators can identify potential issues earlier, understand their capacity environment, and make more informed decisions about resource management.
For anyone responsible for administering Microsoft Fabric, this is a useful addition to the platform's growing set of monitoring and management capabilities.


Join the conversation! Your thoughts help the community grow.