

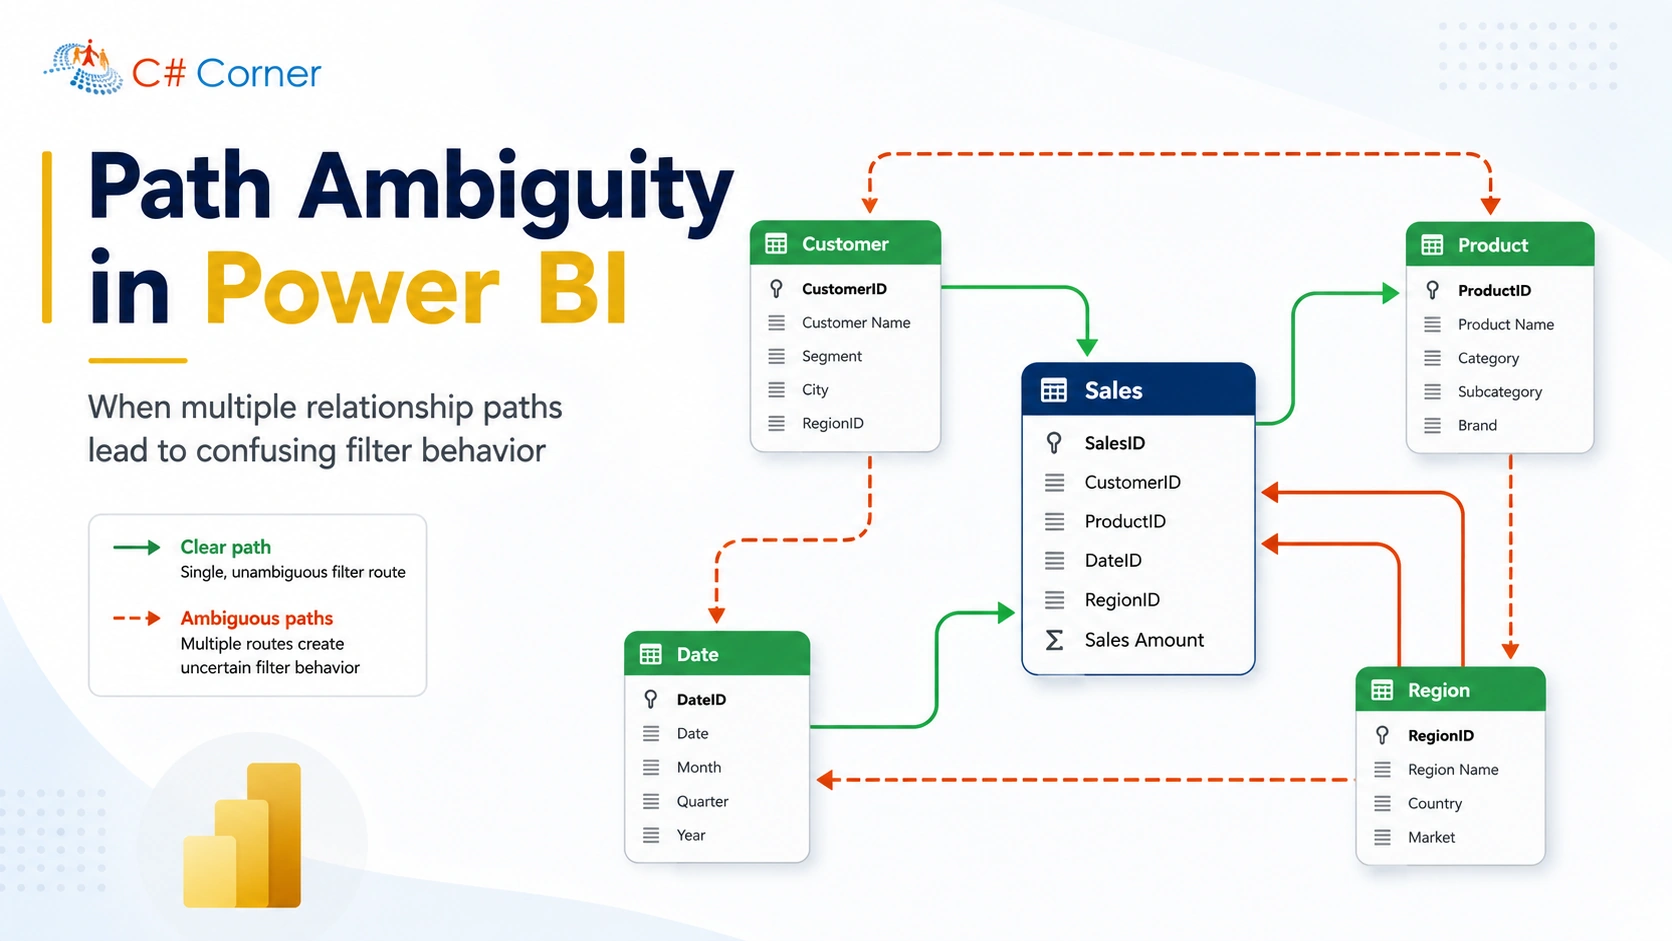
In Power BI, relationships are not just lines between tables.
They define how filters travel across the semantic model. When there is more than one valid route for a filter to move from one table to another, the model can become ambiguous. This is known as path ambiguity.
Path ambiguity is one of the most common reasons why Power BI reports return confusing totals, unexpected filtering behavior, circular relationship errors or performance issues.
In this article, we will understand what path ambiguity means, why it happens, how to identify it, and how to fix it using proper data modeling techniques.
Good report = good model
A good Power BI report starts with a good model. Many report issues that look like DAX problems are actually data modeling problems. One of these problems is ambiguous relationship paths.
Imagine that a filter from a Customer table can reach a Sales table through 2 different routes. Power BI now has to decide which path should be used to filter the data.
In simple models, this may not be a problem. But in complex models with many-to-many relationships, bidirectional filters, bridge tables or multiple fact tables, this can quickly create unreliable or hard-to-explain results.
What is path ambiguity?
Path ambiguity happens when Power BI has multiple possible filter paths between two tables.
A filter path is the route that a filter follows through relationships. For example:
Customer → Sales
This is a simple and clear path. If a user selects a customer, Power BI filters the sales rows for that customer.
But now imagine this model:
Customer → Sales
Customer → CustomerRegion → Region → Sales
In this case, a filter from Customer can reach Sales directly, or it can travel through CustomerRegion and Region. This creates more than one possible route.
That is path ambiguity.
Power BI expects models to have clear, intentional filter paths. When the model contains multiple active paths, Power BI may block the relationship, show an ambiguity warning, or allow the model but produce results that are difficult to debug.
Why filter paths matter in Power BI ?
Power BI relationships control filter propagation. In a typical star schema, filters flow from dimension tables to fact tables.
Example:
Date     → Sales
Product   → Sales
Customer  → Sales
Store     → Sales
This design is clean because each dimension filters the fact table directly. There is no confusion about how filters should move.
A measure such as the following works predictably:
Total Sales =
SUM ( Sales[Sales Amount] )
If the user selects a product, the Product table filters the Sales table. If the user selects a date, the Date table filters the Sales table. Each filter has one clear path.
Ambiguity starts when the same filter can reach the same target table through multiple routes.
Common causes of path ambiguity
1. Too many bidirectional relationships
Bidirectional relationships allow filters to move in both directions. They can be useful in specific scenarios, but they are also one of the biggest causes of ambiguity.
Example:
Customer ↔ Sales ↔ ProductWith bidirectional filtering, selecting a product can filter sales, which can then filter customers. Selecting a customer can also filter sales which can then filter products.
This may look useful at first, especially for slicers. However, in larger models it can create filter paths that were never intended.
We can use single direction relationships by default. Only use bidirectional relationships when there is a clear business requirement and you fully understand the impact.
2. Multiple fact tables connected through shared dimensions
A common model contains several fact tables:
Date → Sales
Date → Budget
Product → Sales
Product → Budget
This is usually fine if relationships are single-direction from dimensions to facts.
The problem appears when developers try to make fact tables filter each other by enabling bidirectional relationships.
Example:
Sales ↔ Product ↔ Budget
Sales ↔ Date ↔ Budget
Now Sales can influence Budget through Product through Dateor through both. This creates ambiguity.
Fact tables should usually not filter other fact tables directly. We must use shared dimensions to compare facts instead.
3. Many-to-many relationships without a proper bridge
Many-to-many relationships are common in real business scenarios.
Examples:
A customer can belong to many segments.
A product can belong to many campaigns.
An account can be owned by multiple users.
A poor model might look like this:
Customer ↔ Account
Account ↔ Sales
Customer ↔ Sales
This can create multiple routes between Customer and Sales.
A better design is usually to introduce a bridge table:
Customer → CustomerAccountBridge ← Account
Account → Sales
The bridge table makes the relationship explicit and easier to control.
We should treat many-to-many scenarios as special modeling cases. We can use bridge tables carefully and avoid enabling bidirectional filtering everywhere.
4. Role-playing dimensions with multiple active relationships
A role-playing dimension is a dimension used for multiple business roles.
Example:
Date → Sales[Order Date]
Date → Sales[Ship Date]
Date → Sales[Delivery Date]
Power BI allows only one active relationship between two tables for normal filter propagation. The other relationships should be inactive and activated only inside specific measures.
Example:
Sales By Ship Date =
CALCULATE (
    [Total Sales],
    USERELATIONSHIP ( Sales[Ship Date], 'Date'[Date] )
)
This avoids ambiguity because only one date relationship is active by default.
A recent model I have been working on :
Let's consider the following model:
Customer → Sales
Customer → Region
Region → Sales
Here, Customer can filter Sales directly. It can also filter Region, which then filters Sales.
If a report user selects a customer, should Power BI filter sales using the direct customer relationship, or should it filter sales based on the customer’s region?
Both paths are technically valid, but they may produce different results.
The direct path answers:
What sales belong to this customer?
The region path answers:
What sales belong to the region of this customer?
These are not the same business question. That is why ambiguous paths are dangerous: the model may mix different business meanings.
Symptoms of path ambiguity
You may have a path ambiguity problem if you notice any of the following symptoms:
Power BI prevents you from creating a relationship.
You see an error saying there is already a relationship path between tables.
Totals change unexpectedly after enabling bidirectional filtering.
Slicers filter other slicers in a confusing way.
A measure works correctly in one visual but not another.
Report performance becomes slower after adding relationships.
Users cannot explain why a value appears or disappears.
The model diagram looks like a spider web instead of a star schema.
The last point is important. If the relationship view is hard to understand visually, the engine will probably also have a harder job resolving filters efficiently.
How to fix path ambiguity ?
1. Return To A Star Schema
The best fix is often not a DAX trick. It is model redesign.
A star schema contains:
Dimension tables, such as
Date,Product,Customer, andRegionFact tables, such as
Sales,Budget, orInventoryOne-to-many relationships from dimensions to facts
Single-direction filtering from dimensions to facts
Example:
Date      → Sales
Product   → Sales
Customer  → Sales
Region    → Sales
This is simple, scalable, and easier to maintain.
2. Avoid bidirectional relationships by default
Do not set relationships to Both just because a slicer does not behave the way you expect.
Before enabling bidirectional filtering, ask:
Why do I need this filter to move backwards?
Can I solve the requirement using a measure instead?
Will this create another path to the same table?
Will this affect other report pages?
In many cases, the safer option is to keep the relationship single-direction and use DAX only where needed.
3. Use inactive relationships for alternative business Logic
If the same dimension connects to the same fact table in multiple ways, keep only one active relationship.
Example:
Date → Sales[Order Date]      Active
Date → Sales[Ship Date]       Inactive
Date → Sales[Delivery Date]   Inactive
Then create specific measures:
Sales By Order Date =
[Total Sales]
Sales By Ship Date =
CALCULATE (
[Total Sales],
USERELATIONSHIP ( Sales[Ship Date], 'Date'[Date] )
)Sales By Delivery Date =
CALCULATE (
[Total Sales],
USERELATIONSHIP ( Sales[Delivery Date], 'Date'[Date] )
)4. Use CROSSFILTER carefully inside measures
Sometimes you need a relationship to behave differently for one calculation only. In that case, CROSSFILTER can be used inside CALCULATE.
Example:
Customers With Sales =
CALCULATE (
    DISTINCTCOUNT ( Customer[Customer ID] ),
    CROSSFILTER ( Customer[Customer ID], Sales[Customer ID], BOTH )
)
This is safer than enabling bidirectional filtering globally because the change applies only to this measure.
However, it should still be used carefully. If the model already has multiple paths, CROSSFILTER can also contribute to ambiguity.
5. Use Bridge tables for many-to-many scenarios
For many-to-many relationships, create a bridge table that contains the valid combinations.
Example:
Customer → CustomerSegmentBridge ← Segment
Customer → Sales
This makes the many-to-many logic visible in the model.
A bridge table should usually contain only keys and should be controlled carefully. Avoid turning every relationship around the bridge into bidirectional unless it is truly required.
6. Hide technical keys from report users
Sometimes ambiguity is not only caused by the model. It is caused by users dragging fields from the wrong table.
For example, if users drag Sales[Product ID] instead of Product[Product Name], they may bypass the intended dimension logic.
A good practice is to hide foreign keys and technical columns from the report view.
Hide columns such as:
Fact table foreign keys
Surrogate keys
Bridge table keys
Internal technical IDs
Expose business friendly fields from dimensions instead.
Path ambiguity in Power BI happens when multiple filter routes exist between tables. It is commonly caused by excessive bidirectional relationships, poorly designed many-to-many relationships, shortcut relationships, and unclear role-playing dimensions.
The best way to avoid ambiguity is to design the model around a clean star schema, use single-direction relationships by default, handle alternative paths with inactive relationships, and apply DAX functions like USERELATIONSHIP or CROSSFILTER only when necessary.
When a Power BI report returns confusing numbers, do not immediately blame the measure. First, check the model. A clear model produces clear DAX, better performance, and more trustworthy reports.
A simple rule to remember is:
Every important filter should have one clear, intentional path.
If your model follows that rule, your reports will be easier to build, easier to debug, and easier for business users to trust.
Join the conversation! Your thoughts help the community grow.