

Background
Sometimes we need to show data in a chart like a Pie chart, such as to show quarterly data and on, so by considering the preceding requirement and to introduce the ASP.Net Pie Chart controls I have decided to write this article.Let us learn about the ASP.Net chart type Pie chart that provides a powerful UI and design quality. We will learn about these chart type controls step-by-step. All the charts are in the System.Web.UI.DataVisualization.Charting namespace.
Chart data is represented using the following points:
- X Axis: the horizontal line of the chart termed the X axis
- Y Axis: the vertical line of the chart termed the Y axis
Now let us learn about the properties of the Pie chart. A Pie chart type has the following common properties:
- AlternetText: Sets the alternate text when the image is not available
- Annotation: Stores the chart annotations
- AntiAliasing: sets a value that determines whether anti-aliasing is used when text and graphics are drawn
- BackGradientStyle: sets the orientation for the background gradient for the Chart control. Also determines whether a gradient is used, the default is None
- Backcolor: sets the background color for a chart, the default color is White
- BackImage: sets the background image for the chart control.
- BackHatchStyle: sets the hatching style for the chart control, the default is None.
- Height: Sets the height for the chart control
- Width: Sets the width for the chart control
- Palette: Sets the style with the color for the chart control, the default style is Chocolate.
- PaletteCustomColors: Sets the custom color for the chart control.
- Series: Sets the series collection for the chart control
- Legends: Sets the series of legends to the chart
Now let us show the preceding explanation with a practical example by creating a simple web application.
Step 1: Create the table for the chart data
Now before creating the application, let us create a table named QuarterwiseSale in a database from where we show the records in the chart using the following script:
- CREATE TABLE [dbo].[QuarterwiseSale](
- [id] [int] IDENTITY(1,1) NOT NULL,
- [Quarter] [varchar](50) NULL,
- [SalesValue] [money] NULL,
- CONSTRAINT [PK_QuarterwiseSale] PRIMARY KEY CLUSTERED
- (
- [id] ASC
- )WITH (PAD_INDEX = OFF, STATISTICS_NORECOMPUTE = OFF, IGNORE_DUP_KEY = OFF, ALLOW_ROW_LOCKS = ON, ALLOW_PAGE_LOCKS = ON) ON [PRIMARY]
- ) ON [PRIMARY]
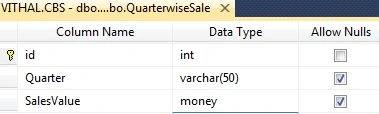
The table has the following fields (shown in the following image):
Now insert some records using the following script:
- SET IDENTITY_INSERT [dbo].[QuarterwiseSale] ON
- GO
- INSERT [dbo].[QuarterwiseSale] ([id], [Quarter], [SalesValue]) VALUES (1, N'Q1', 100.0000)
- GO
- INSERT [dbo].[QuarterwiseSale] ([id], [Quarter], [SalesValue]) VALUES (2, N'Q2', 50.0000)
- GO
- INSERT [dbo].[QuarterwiseSale] ([id], [Quarter], [SalesValue]) VALUES (3, N'Q3', 150.0000)
- GO
- INSERT [dbo].[QuarterwiseSale] ([id], [Quarter], [SalesValue]) VALUES (4, N'Q4', 200.0000)
- GO
- SET IDENTITY_INSERT [dbo].[QuarterwiseSale] OFF
- GO
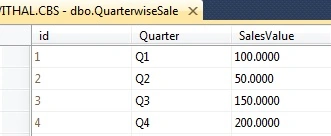
Now the records will look as in the list in the following image:
Now create the Stored Procedure to fetch the records from database as in the following:
- Create Procedure [dbo].[GetSaleData]
- (
- @id int=null
- )
- as
- begin
- Select Quarter,SalesValue from QuarterwiseSale
- End
I hope you have the same type of table and records as above.
Step: 2 Create Web Application
Now create the project using the following:
- "Start" - "All Programs" - "Microsoft Visual Studio 2010".
- "File" - "New Project" - "C#" - "Empty Project" (to avoid adding a master page).
- Provide the project a name such as UsingPieChart or another as you wish and specify the location.
- Then right-click on Solution Explorer and select "Add New Item" then select Default.aspx page.
- Drag and Drop a Chart control from the ToolBox onto the Default.aspx page.
Now the Default.aspx source code will be as follows:
- <%@ Page Language="C#" AutoEventWireup="true" CodeFile="Default.aspx.cs" Inherits="_Default" %>
- <%@ Register Assembly="System.Web.DataVisualization, Version=4.0.0.0, Culture=neutral, PublicKeyToken=31bf3856ad364e35"
- Namespace="System.Web.UI.DataVisualization.Charting" TagPrefix="asp" %>
- <!DOCTYPE html PUBLIC "-//W3C//DTD XHTML 1.0 Transitional//EN" "http://www.w3.org/TR/xhtml1/DTD/xhtml1-transitional.dtd">
- <html xmlns="http://www.w3.org/1999/xhtml">
- <head runat="server">
- <title>Article by Vithal Wadje</title>
- </head>
- <body bgcolor="Navy">
- <form id="form1" runat="server">
- <h4 style="color: White;">
- Article for C#Corner
- </h4>
- <asp:Chart ID="Chart1" runat="server" BackColor="0, 0, 64" BackGradientStyle="LeftRight"
- BorderlineWidth="0" Height="360px" Palette="None" PaletteCustomColors="Maroon"
- Width="380px" BorderlineColor="64, 0, 64">
- <Titles>
- <asp:Title ShadowOffset="10" Name="Items" />
- </Titles>
- <Legends>
- <asp:Legend Alignment="Center" Docking="Bottom" IsTextAutoFit="False" Name="Default"
- LegendStyle="Row" />
- </Legends>
- <Series>
- <asp:Series Name="Default" />
- </Series>
- <ChartAreas>
- <asp:ChartArea Name="ChartArea1" BorderWidth="0" />
- </ChartAreas>
- </asp:Chart>
- </form>
- </body>
- </html>
- private void Bindchart()
- {
- connection();
- com = new SqlCommand("GetSaleData", con);
- com.CommandType = CommandType.StoredProcedure;
- SqlDataAdapter da = new SqlDataAdapter(com);
- DataSet ds = new DataSet();
- da.Fill(ds);
- DataTable ChartData = ds.Tables[0];
- //storing total rows count to loop on each Record
- string[] XPointMember = new string[ChartData.Rows.Count];
- int[] YPointMember = new int[ChartData.Rows.Count];
- for (int count = 0; count < ChartData.Rows.Count; count++)
- {
- //storing Values for X axis
- XPointMember[count] = ChartData.Rows[count]["Quarter"].ToString();
- //storing values for Y Axis
- YPointMember[count] = Convert.ToInt32(ChartData.Rows[count]["SalesValue"]);
- }
- //binding chart control
- Chart1.Series[0].Points.DataBindXY(XPointMember, YPointMember);
- //Setting width of line
- Chart1.Series[0].BorderWidth = 10;
- //setting Chart type
- Chart1.Series[0].ChartType = SeriesChartType.Pie;
- foreach (Series charts in Chart1.Series)
- {
- foreach (DataPoint point in charts.Points)
- {
- switch (point.AxisLabel)
- {
- case "Q1": point.Color = Color.RoyalBlue; break;
- case "Q2": point.Color = Color.SaddleBrown; break;
- case "Q3": point.Color = Color.SpringGreen; break;
- }
- point.Label = string.Format("{0:0} - {1}", point.YValues[0], point.AxisLabel);
- }
- }
- //Enabled 3D
- // Chart1.ChartAreas["ChartArea1"].Area3DStyle.Enable3D = true;
- con.Close();
- }
- //To give different color for each point
- foreach (Series charts in Chart1.Series)
- {
- foreach (DataPoint point in charts.Points)
- {
- switch (point.AxisLabel)
- {
- case "Q1": point.Color = Color.RoyalBlue; break;
- case "Q2": point.Color = Color.SaddleBrown; break;
- case "Q3": point.Color = Color.SpringGreen; break;
- }
- point.Label = string.Format("{0:0} - {1}", point.YValues[0], point.AxisLabel);
- }
- }
Now, call the preceding function on page load as in the following:
- protected void Page_Load(object sender, EventArgs e)
- {
- if (!IsPostBack)
- {
- Bindchart();
- }
- }
The entire code of the default.aspx.cs page will look as follows:
- using System;
- using System.Collections.Generic;
- using System.Linq;
- using System.Web;
- using System.Web.UI;
- using System.Web.UI.WebControls;
- using System.Data.SqlClient;
- using System.Configuration;
- using System.Data;
- using System.Web.UI.DataVisualization.Charting;
- using System.Drawing;
- public partial class _Default : System.Web.UI.Page
- {
- private SqlConnection con;
- private SqlCommand com;
- private string constr, query;
- private void connection()
- {
- constr = ConfigurationManager.ConnectionStrings["getconn"].ToString();
- con = new SqlConnection(constr);
- con.Open();
- }
- protected void Page_Load(object sender, EventArgs e)
- {
- if (!IsPostBack)
- {
- Bindchart();
- }
- }
- private void Bindchart()
- {
- connection();
- com = new SqlCommand("GetSaleData", con);
- com.CommandType = CommandType.StoredProcedure;
- SqlDataAdapter da = new SqlDataAdapter(com);
- DataSet ds = new DataSet();
- da.Fill(ds);
- DataTable ChartData = ds.Tables[0];
- //storing total rows count to loop on each Record
- string[] XPointMember = new string[ChartData.Rows.Count];
- int[] YPointMember = new int[ChartData.Rows.Count];
- for (int count = 0; count < ChartData.Rows.Count; count++)
- {
- //storing Values for X axis
- XPointMember[count] = ChartData.Rows[count]["Quarter"].ToString();
- //storing values for Y Axis
- YPointMember[count] = Convert.ToInt32(ChartData.Rows[count]["SalesValue"]);
- }
- //binding chart control
- Chart1.Series[0].Points.DataBindXY(XPointMember, YPointMember);
- //Setting width of line
- Chart1.Series[0].BorderWidth = 10;
- //setting Chart type
- Chart1.Series[0].ChartType = SeriesChartType.Pie;
- foreach (Series charts in Chart1.Series)
- {
- foreach (DataPoint point in charts.Points)
- {
- switch (point.AxisLabel)
- {
- case "Q1": point.Color = Color.RoyalBlue; break;
- case "Q2": point.Color = Color.SaddleBrown; break;
- case "Q3": point.Color = Color.SpringGreen; break;
- }
- point.Label = string.Format("{0:0} - {1}", point.YValues[0], point.AxisLabel);
- }
- }
- //Enabled 3D
- // Chart1.ChartAreas["ChartArea1"].Area3DStyle.Enable3D = true;
- con.Close();
- }
- }
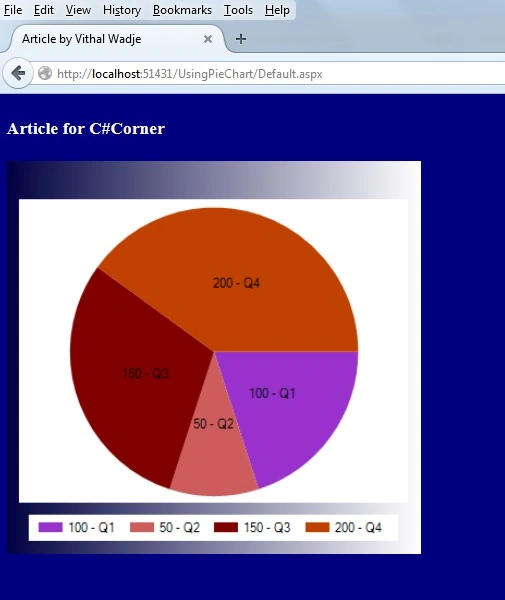
We now have the entire logic to bind the chart from the database, let us run the application. The chart will look as follows:
Now let us change the Point color as:
- foreach (Series charts in Chart1.Series)
- {
- foreach (DataPoint point in charts.Points)
- {
- switch (point.AxisLabel)
- {
- case "Q1": point.Color = Color.YellowGreen; break;
- case "Q2": point.Color = Color.Yellow; break;
- case "Q3": point.Color = Color.SpringGreen; break;
- }
- point.Label = string.Format("{0:0} - {1}", point.YValues[0], point.AxisLabel);
- }
- }
Now the chart will look as follows:
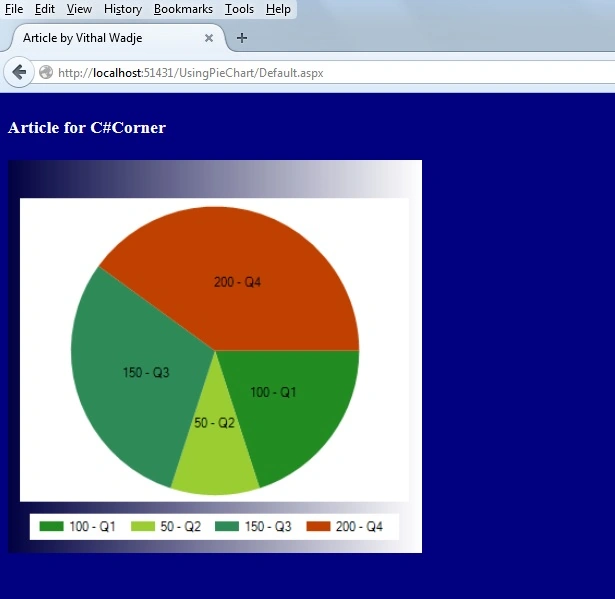
In the preceding chart we saw how the data is properly arranged with the user interactive graphics, now let us set the 3D style enabled as in the following:
- Chart1.ChartAreas["ChartArea1"].Area3DStyle.Enable3D = true;
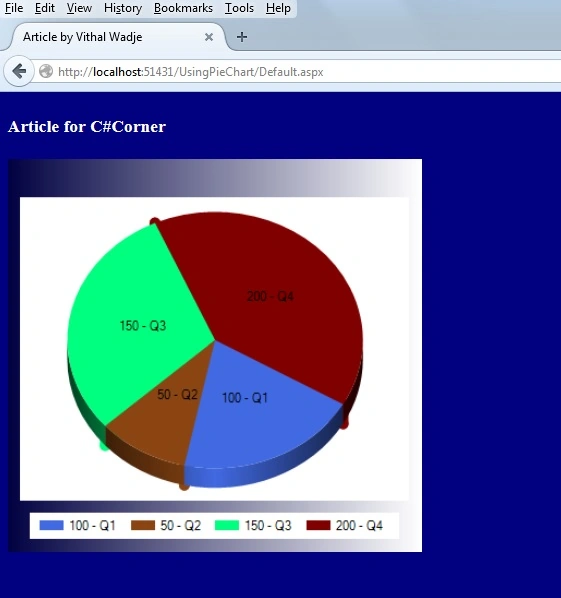
Now change the Border width as:
- //Setting width of line
- Chart1.Series[0].BorderWidth = 4;
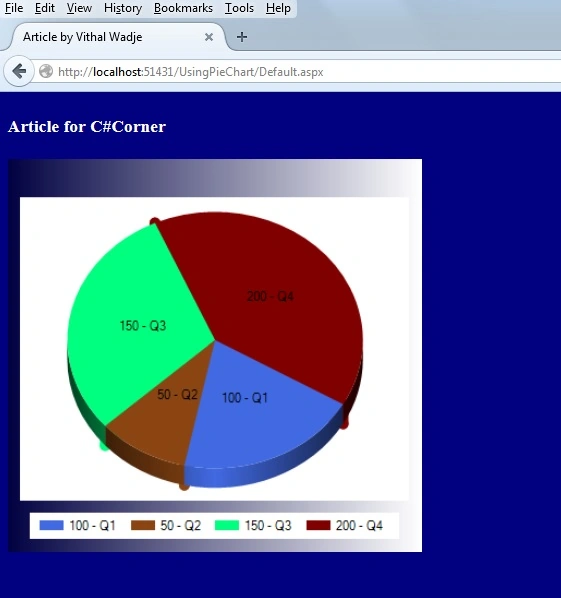
Now from all the preceding explanations we saw how to create and use a Pie type chart.
Notes
Notes
- Download the Zip file from the attachment for the full source code of the application.
- Change the connection string in the web.config file to specify your server location.
Summary
My next article explains another chart type of ASP.Net. I hope this article is useful for all readers, if you have any suggestion then please contact me including beginners also.
Krutika KarekarPosted Jun 3, 2019, 1:29 AM
Useful article sir....
Arul SelvamPosted Aug 1, 2018, 1:51 AM
Plz Anyone give your suggestions on this
Arul SelvamPosted Aug 1, 2018, 1:48 AM
Constr = ConfigurationManager.ConnectionStrings["getconn"].ToString();Err at this cmd plz help me to resolve.like "use new key word"
Arul SelvamPosted Aug 1, 2018, 1:47 AM
Iam beginner of Asp.net while im trying to execute below issue throws "System.NullReferenceException was unhandled by user code HResult=-2147467261 Message=Object reference not set to an instance of an object. Source=App_Web_laox2ets StackTrace: at HRMS.GCChart.connection() in f:\HRMS_GBHR-Demo-Site\hrms_New\HRMS\GC\GCChart.aspx.cs:line 24 at HRMS.GCChart.Bindchart() in f:\HRMS_GBHR-Demo-Site\hrms_New\HRMS\GC\GCChart.aspx.cs:line 42 at HRMS.GCChart.Page_Load(Object sender, EventArgs e) in f:\HRMS_GBHR-Demo-Site\hrms_New\HRMS\GC\GCChart.aspx.cs:line 34 at System.Web.Util.CalliEventHandlerDelegateProxy.Callback(Object sender, EventArgs e) at System.Web.UI.Control.OnLoad(EventArgs e) at System.Web.UI.Control.LoadRecursive() at System.Web.UI.Page.ProcessRequestMain(Boolean includeStagesBeforeAsyncPoint, Boolean includeStagesAfterAsyncPoint) InnerException: "
Arul SelvamPosted Aug 1, 2018, 1:44 AM
" constr = ConfigurationManager.ConnectionStrings["getconn"].ToString();"
Nishad BrahmbhattPosted May 26, 2018, 2:04 AM
Nicely explained and useful while coding
RATANJEET SINGHPosted Apr 14, 2018, 4:25 AM
Very nice efforts. thanks.
Deepak RaiPosted Jun 7, 2017, 10:17 PM
Thanks Vithal Wadje for your help it works awesome for me. But there is other issue in my project i want to show two columns(Yes and No) in x axis with int values as my table structure is this [SNo] [int] IDENTITY(1,1) NOT NULL, [Question] [nvarchar](max) NOT NULL, [Yes] [int] NOT NULL, [No] [int] NOT NULL please help me out .
MukeshPosted Mar 6, 2017, 11:43 PM
This is perfect But When i Want Show Q1,Q2,Q3,Q4 only in Pie Chart and 50,100.150,200 value in Bottom Border so How to do Please Help Me
Апостол АпостоловPosted Aug 31, 2016, 1:00 AM
There's a very good ASP.net suite that you can find on ShieldUI. You got over 70 widgets, including chart, grid, combo and Input components, QR codes and everything. It all comes with an API where you can customize everything interactively. Check it out on https://www.shieldui.com/products/aspnet
Vithal WadjePosted Jan 10, 2015, 1:00 AM
Thanks a lot Dinesh Beniwal sir for your great support and motivation
Dinesh BeniwalPosted Jan 9, 2015, 10:02 PM
One more article of the Day
Vithal WadjePosted Jan 6, 2015, 11:40 AM
Thanks KP Sir
K P Singh ChundawatPosted Jan 6, 2015, 11:19 AM
Great ...
Vithal WadjePosted Jan 5, 2015, 12:21 AM
Thanks Manish and Praveen Sir
Vithal WadjePosted Jan 5, 2015, 12:21 AM
Thanks Mahesh sir ,I will change
Praveen KumarPosted Jan 4, 2015, 11:19 PM
Superb!
Manish Kumar ChoudharyPosted Jan 4, 2015, 11:16 PM
Nice one..
Mahesh ChandPosted Jan 4, 2015, 11:08 PM
Nice. Change title to "Pie Chart in ASP.NET". That is what people will more likely to search. Also background of the page blue is too much :).