

INTRODUCTION
Power BI is one of the most powerful tools for data visualization and business intelligence. It’s user-friendly, free to get started, and packed with features that help turn raw data into clear, interactive insights.
If you're new to Power BI, this guide is for you. We’ll cover:
- ✅ What is Power BI
- ✅ How to install Power BI Desktop
- ✅ Importing your first dataset
- ✅ Building your first dashboard
- ✅ Publishing your report
🔍 What is Power BI?
Power BI is a data visualization tool developed by Microsoft. It helps you:
- Connect to different data sources (Excel, databases, websites, APIs, etc.)
- Clean and shape your data
- Create interactive reports and dashboards
- Share insights with others via the web or mobile
It’s widely used by analysts, marketers, students, and even small business owners to make data-driven decisions.
💻 Step 1. Installing Power BI Desktop
Power BI Desktop is free to download and install on Windows.
👉 How to install?
- Go to the Power BI download page
- Click on “Download free”
- Install the .exe file and launch Power BI
🔧 Note. You need Windows 10 or later to run Power BI Desktop.
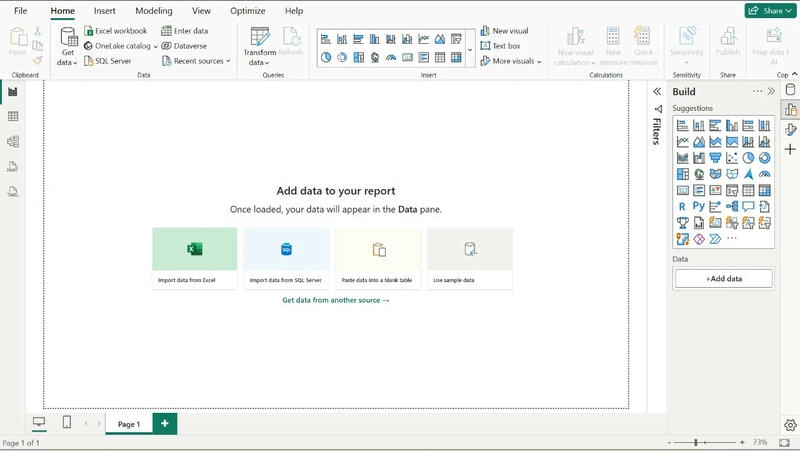
📂 Step 2. Import Your First Dataset
Let’s use a sample Excel file to get started.
Example: Sales.xlsx
- Click “Get Data”
- Choose Excel
- Browse and select your file
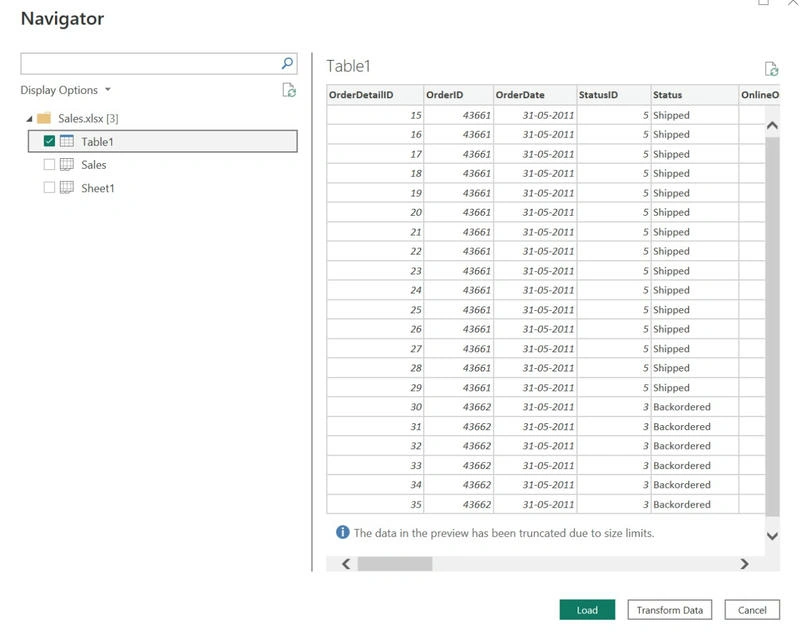
- Select the sheet (e.g., “Sales”) and click Load
You’ll see your data appear in the Fields pane on the right.
🧹 Step 3. Clean and Transform (Optional)
Use Power Query Editor if you want to:
- Rename columns
- Remove empty rows
- Change data types (e.g., date, number)
- Merge or split columns
To open Power Query:
Click Transform Data
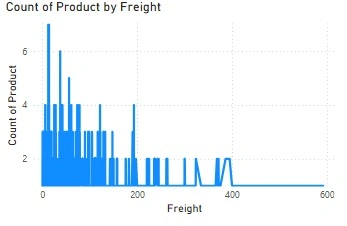
📊 Step 4. Build Your First Dashboard
Now comes the fun part — building visuals!
🎨 Example visuals you can create:
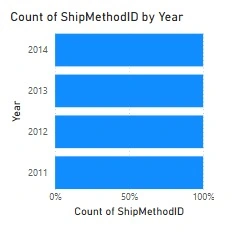
- Bar chart: Sales by Region
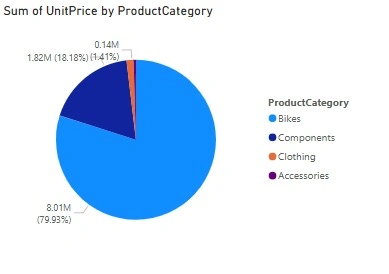
- Pie chart: Sales by Product Category
- Card: Total Revenue
- Line chart: Sales over Time
How to create?
- Select a visual (e.g., Bar chart) from the Visualizations pane
- Drag fields like Region and Sales into the visual
- Resize and move the visual around your canvas
You can repeat this with different visuals to create a full dashboard.
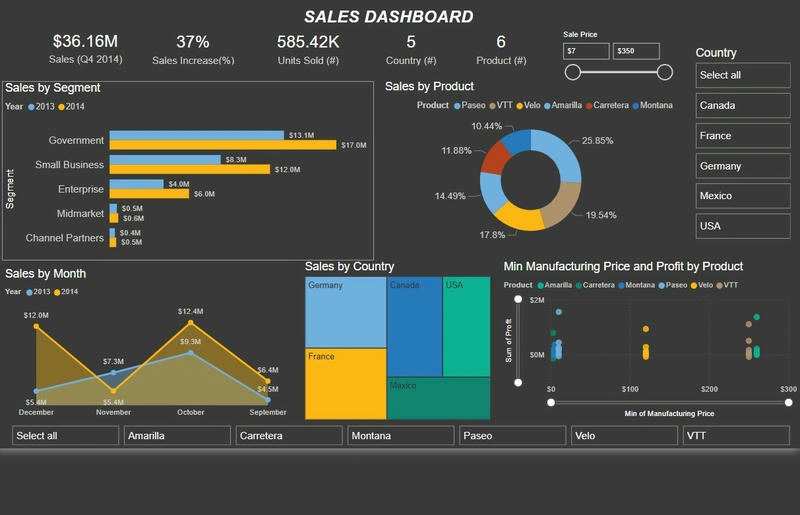
🔁 Step 5. Add Interactivity with Slicers
Slicers allow users to filter the dashboard interactively.
To add:
- Click the Slicer visual
- Drag a field (e.g., Month or Product) into it
- Use the slider to see data change dynamically!

🌐 Step 6. Publish Your Report
To share your dashboard:
- Click Publish
- Sign in with a Microsoft account
- Choose or create a workspace
- Access your report online at PowerBI.com
You can also:
- Embed in websites
- Share with teammates
- View it on your phone using the Power BI mobile app
In this article, you learned how to install Power BI, load a dataset, and build your very first dashboard. This is just the beginning!
In the next article, we’ll dive into data modeling, relationships, and creating calculated fields using DAX. Stay tuned!
Join the conversation! Your thoughts help the community grow.