

Introduction
Power BI Paginated Reports are a type of report that is designed to be printed or shared. They are formatted to fit well on a page, and they display all the data in a table, even if the table spans multiple pages. You can control the report layout exactly. Here are some of the features and Limitations of Power BI Paginated Reports:
| Featured | |
| Pixel-Perfect Layouts | Paginated Reports in Power BI are designed to create fixed-layout, pixel-perfect reports. Users have precise control over report elements' placement and sizing, ensuring consistent formatting and alignment, which is crucial for printed or PDF-based reports. |
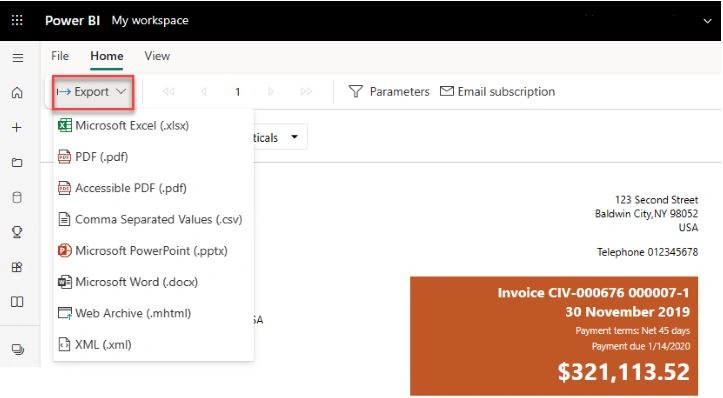
| Print-Ready Reports | Paginated Reports are optimized for printing or exporting to formats like PDF, Word, Excel, PowerPoint, and others. This makes them suitable for scenarios where hard copies of reports are required, such as financial statements, invoices, or regulatory filings. |
| Data Source Support | Paginated Reports can connect to various data sources, including Power BI datasets, Azure SQL Database, Azure Analysis Services, SQL Server Analysis Services (SSAS), Oracle, SharePoint lists, and more. This enables users to fetch data from different systems for reporting purposes. |
| Advanced Pagination Options | Users can define page breaks, headers, footers, and repeating rows or columns to control the report's layout for printing and reading convenience. This allows for improved report organization and navigation. |
| Rich Formatting Options | Paginated Reports offer extensive formatting capabilities, allowing users to customize fonts, colors, borders, background colors, and other design elements. Users can apply consistent styling across the entire report. |
| Expressions and Parameters | Users can use expressions and parameters in Paginated Reports to create dynamic and interactive reports. Parameters enable users to customize report outputs based on selected values, making the reports more flexible. |
| Drill through Actions | Paginated Reports can include drill-through actions, enabling users to navigate from summary reports to detailed information. This helps in exploring data at various levels of granularity. |
| Data Regions | Paginated Reports support data regions like tables, matrices, charts, and other data visualizations. Users can create tabular reports, cross-tab reports, and charts with different chart types. |
| Data Export and Distribution | Paginated Reports allow users to export data directly from the report to supported formats like CSV, Excel, and PDF. The reports can be scheduled for automatic distribution via email or stored in SharePoint libraries. |
Join the conversation! Your thoughts help the community grow.