

I'll be honest: when designing Power BI reports, I sometimes spend so much time choosing the right chart, adjusting the colours, and formatting data labels that I forget how important the legend can be.
But here's something worth thinking about: A chart can display the right numbers and still leave users wondering what the colours actually mean.
That's exactly why I pay attention to the Legend in Power BI.
Let's look at the example below.
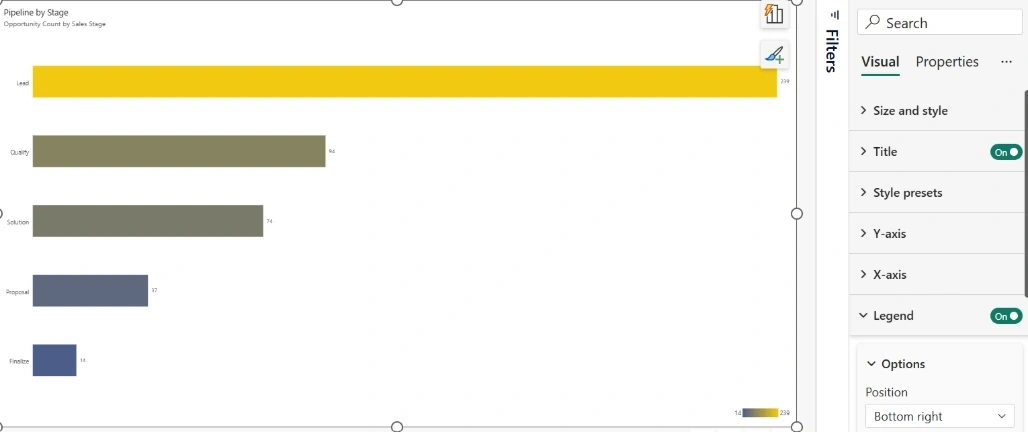
In this example, I have a report visual titled Pipeline by Stage, showing the opportunity count across different sales stages.
The values are:
- Lead: 239
- Qualify: 94
- Solution: 74
- Proposal: 37
- Finalize: 14
Now, notice something interesting about the bars. They don't all have the same colour.
The Lead stage is displayed in yellow, while Finalize is displayed in blue. The other stages have different shades in between.
But how does someone viewing this report know what those colours represent?
That's where the Legend comes in.
1. What exactly does the Legend communicate?
In this example, the legend is positioned at the bottom-right corner of the visual.
It displays a colour gradient ranging from 14 to 239.
This is important because the legend communicates the relationship between the colours and the underlying numerical values.
Here's how I interpret it:
- 🔵 Blue: Represents the lower end of the opportunity count.
- 🟢 Intermediate shades: Represent values between the minimum and maximum.
- 🟡 Yellow: Represents the higher end of the opportunity count.
Without the legend, users might see different colours across the bars but have no clear indication of what those colours represent.
With the legend enabled, the visual becomes easier to interpret.
2. Why is the Legend important?
I consider the legend more than just another formatting option in Power BI.
Here are a few reasons why.
A. It provides context
Colours should communicate something meaningful. The legend helps users understand what those colours represent instead of leaving them to guess.
B. It improves data interpretation
When users look at the chart, they can quickly distinguish between higher and lower values through the colour gradient.
C. It improves report readability
A well-configured legend makes the visual more self-explanatory, especially when reports are shared with people who didn't build them.
D. It supports better storytelling
Remember, Power BI reports are not just about displaying numbers. They are about communicating insights. A meaningful colour scale helps reinforce the story behind the data.
3. Customising the Legend in Power BI
One thing I particularly like about Power BI is that you can customise how the legend appears in your visual.
From the Format visual pane, you can navigate to the Legend settings and control its visibility and position.
Depending on the visual and formatting options available, you can adjust how the legend is presented to suit your report design.
In my example, I've enabled the Legend and positioned it at the Bottom right.
A small formatting decision, but it makes a difference to how users interpret the visual.
4. My takeaway
I don't believe every Power BI visual needs a legend. Sometimes, adding one when it isn't necessary only creates visual clutter.
However, whenever I'm using different colours to communicate numerical values, categories, or data series, I want users to understand what those colours mean.
Never make your report users guess what your colours represent. Give them the context they need.
Arun PottiPosted Nov 22, 2026, 12:37 PM
Good Article.