

Background
Sometimes we need to show data in a chart like a Pyramid chart, such as to show quarterly data and on, so by considering the preceding requirement and to introduce the ASP.Net Pyramid and Funnel Chart controls I have decided to write this article.Let us learn about the ASP.Net chart types Pyramid and Funnel that provide a powerful UI and design quality. So let us start to learn about these chart type controls step-by-step. All the charts are in the System.Web.UI.DataVisualization.Charting namespace.
Chart data is represented using the following points:
- X Axis: the horizontal line of the chart termed the X axis
- Y Axis: the vertical line of the chart termed the Y axis
Now let us learn about the properties of the Pyramid and Funnel charts.
- AlternetText: Sets the alternate text when the image is not available
- Annotation: Stores the chart annotations
- AntiAliasing: sets a value that determines whether anti-aliasing is used when text and graphics are drawn
- BackGradientStyle: sets the orientation for the background gradient for the Chart control. Also determines whether a gradient is used, the default is None
- Backcolor: sets the background color for a chart, the default color is White
- BackImage: sets the background image for the chart control.
- BackHatchStyle: sets the hatching style for the chart control, the default is None.
- Height: Sets the height for the chart control
- Width: Sets the width for the chart control
- Palette: Sets the style with the color for the chart control, the default style is Chocolate.
- PaletteCustomColors: Sets the custom color for the chart control.
- Series: Sets the series collection for the chart control
- Legends: Sets the series of legends to the chart
Now let us show the preceding explanation with a practical example by creating a simple web application.
Step 1: Create the table for the chart data
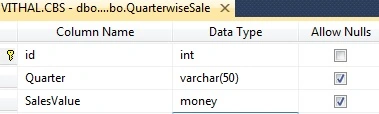
Now before creating the application, let us create a table named QuarterwiseSale in a database from where we show the records in the chart, the table has the following fields (shown in the following image):
Now insert some records as listed in the following image into the table:
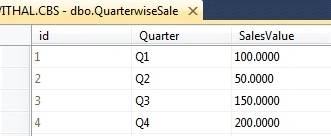
I hope you have the same type of table and records as above.
Step: 2 Create Web Application
Now create the project using the following:
- "Start" - "All Programs" - "Microsoft Visual Studio 2010".
- "File" - "New Project" - "C#" - "Empty Project" (to avoid adding a master page).
- Provide the project a name such as PyramidAndfunnel or another as you wish and specify the location.
- Then right-click on Solution Explorer and select "Add New Item" then select Default.aspx page.
- Drag and Drop a Chart control from the ToolBox onto the Default.aspx page.
Now the Default.aspx source code will be as follows:
- <%@ Page Language="C#" AutoEventWireup="true" CodeFile="Default.aspx.cs" Inherits="_Default" %>
- <%@ Register Assembly="System.Web.DataVisualization, Version=4.0.0.0, Culture=neutral, PublicKeyToken=31bf3856ad364e35"
- Namespace="System.Web.UI.DataVisualization.Charting" TagPrefix="asp" %>
- <!DOCTYPE html PUBLIC "-//W3C//DTD XHTML 1.0 Transitional//EN" "http://www.w3.org/TR/xhtml1/DTD/xhtml1-transitional.dtd">
- <html xmlns="http://www.w3.org/1999/xhtml">
- <head runat="server">
- <title>Article by Vithal Wadje</title>
- </head>
- <body bgcolor="grey">
- <form id="form1" runat="server">
- <h4 style="color: White;">
- Article for C#Corner
- </h4>
- <asp:Chart ID="Chart1" runat="server">
- <Series>
- <asp:Series Name="Series1">
- </asp:Series>
- </Series>
- <ChartAreas>
- <asp:ChartArea Name="ChartArea1">
- </asp:ChartArea>
- </ChartAreas>
- </asp:Chart>
- </form>
- </body>
- </html>
Create a function to bind the chart control as in the following:
- private void Bindchart()
- {
- connection();
- query = "select *from QuarterwiseSale";//not recommended this i have written just for example,write stored procedure for security
- com = new SqlCommand(query, con);
- SqlDataAdapter da = new SqlDataAdapter(query, con);
- DataSet ds = new DataSet();
- da.Fill(ds);
- DataTable ChartData=ds.Tables[0];
- //storing total rows count to loop on each Record
- string[] XPointMember = new string[ChartData.Rows.Count];
- int[] YPointMember = new int[ChartData.Rows.Count];
- for (int count = 0; count < ChartData.Rows.Count;count++ )
- {
- //storing Values for X axis
- XPointMember[count] = ChartData.Rows[count]["Quarter"].ToString();
- //storing values for Y Axis
- YPointMember[count] = Convert.ToInt32(ChartData.Rows[count]["SalesValue"]);
- }
- //binding chart control
- Chart1.Series[0].Points.DataBindXY(XPointMember, YPointMember);
- //setting Chart type
- Chart1.Series[0].ChartType = SeriesChartType.Pyramid;
- // Chart1.Series[0].ChartType = SeriesChartType.Funnel;
- // Chart1.ChartAreas["ChartArea1"].Area3DStyle.Enable3D = true;
- con.Close();
- }
Now, call the preceding function on page load as in the following:
- protected void Page_Load(object sender, EventArgs e)
- {
- if (!IsPostBack)
- {
- Bindchart();
- }
- }
The entire code of the default.aspx.cs page will look as follows:
- using System;
- using System.Collections.Generic;
- using System.Linq;
- using System.Web;
- using System.Web.UI;
- using System.Web.UI.WebControls;
- using System.Data.SqlClient;
- using System.Configuration;
- using System.Data;
- using System.Web.UI.DataVisualization.Charting;
- public partial class _Default : System.Web.UI.Page
- {
- private SqlConnection con;
- private SqlCommand com;
- private string constr, query;
- private void connection()
- {
- constr = ConfigurationManager.ConnectionStrings["getconn"].ToString();
- con = new SqlConnection(constr);
- con.Open();
- }
- protected void Page_Load(object sender, EventArgs e)
- {
- if (!IsPostBack)
- {
- Bindchart();
- }
- }
- private void Bindchart()
- {
- connection();
- query = "select *from QuarterwiseSale";//not recommended this i have written just for example,write stored procedure for security
- com = new SqlCommand(query, con);
- SqlDataAdapter da = new SqlDataAdapter(query, con);
- DataSet ds = new DataSet();
- da.Fill(ds);
- DataTable ChartData=ds.Tables[0];
- //storing total rows count to loop on each Record
- string[] XPointMember = new string[ChartData.Rows.Count];
- int[] YPointMember = new int[ChartData.Rows.Count];
- for (int count = 0; count < ChartData.Rows.Count;count++ )
- {
- //storing Values for X axis
- XPointMember[count] = ChartData.Rows[count]["Quarter"].ToString();
- //storing values for Y Axis
- YPointMember[count] = Convert.ToInt32(ChartData.Rows[count]["SalesValue"]);
- }
- //binding chart control
- Chart1.Series[0].Points.DataBindXY(XPointMember, YPointMember);
- //setting Chart type
- Chart1.Series[0].ChartType = SeriesChartType.Pyramid;
- // Chart1.Series[0].ChartType = SeriesChartType.Funnel;
- // Chart1.ChartAreas["ChartArea1"].Area3DStyle.Enable3D = true;
- con.Close();
- }
- }
We now have the entire logic to bind the chart from the database, let us run the application. The chart will look as follows:
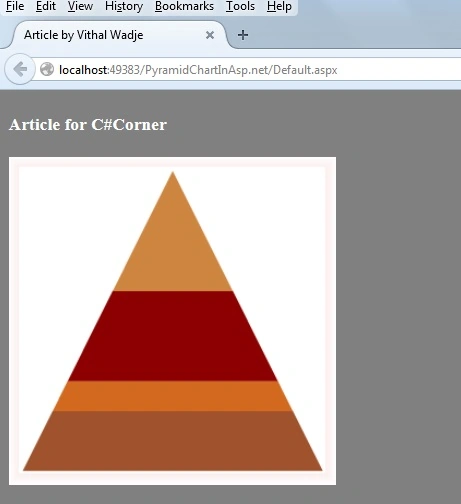
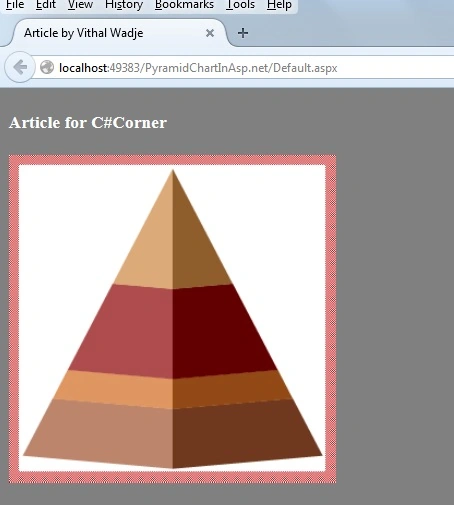
In the preceding chart we saw how the data is properly arranged with the user interactive graphics, now let us set the 3D style enabled as in the following:
- Chart1.ChartAreas["ChartArea1"].Area3DStyle.Enable3D = true;
Now let us switch to a Funnel chart as in the following:
- Chart1.Series[0].ChartType = SeriesChartType.Funnel;
Now run the application and the Funnel type chart will look as follows:
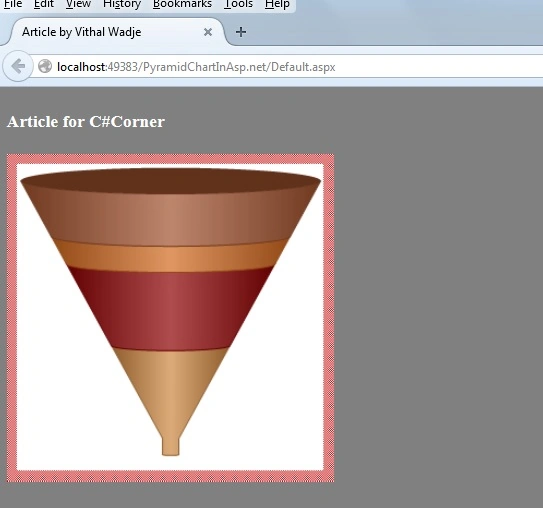
The preceding is the 3D Style Funnel chart. Now let us disable the 3D style as in the following:
- Chart1.ChartAreas["ChartArea1"].Area3DStyle.Enable3D = false;
Now the Funnel chart will look as follows:
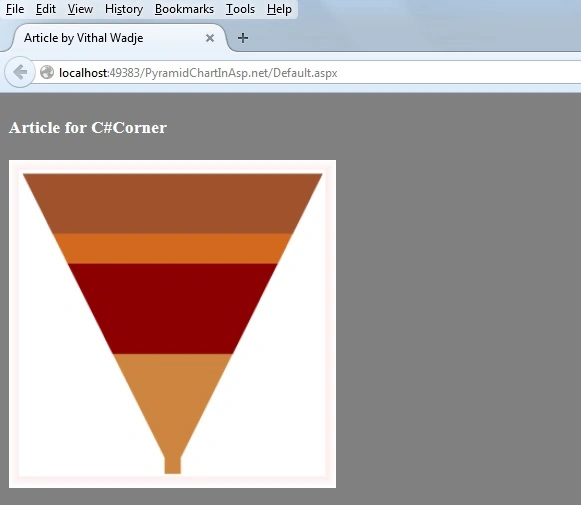
Now from all the preceding explanation we saw how to create and use a Pyramid and Funnel chart.
Notes
Notes
- Download the Zip file from the attachment for the full source code of the application.
- Change the connection string in the web.config file to specify your server location.
Summary
My next article explains another chart type of ASP.Net. I hope this article is useful for all readers, if you have any suggestion then please contact me including beginners also.
Bernard AshtonPosted Jun 16, 2017, 6:52 AM
Tried to load the download but it seems to be incomplete and doesn't seem to include all the files. Is there something else I need to do to get all the files? I am starting to look at a Sales Pipeline for a customer and a basic MVC Funnel Chart would be very useful to provide a simple prototype to get them thinking about what can be done.