

In this article I would like to take you through the usage of:
- Determining the rendering time of a Sandboxed Web Part
- Using a Developer Dashboard
- Resource Quota for Sandboxed Solutions
Sandboxed Solution
A Sandboxed Solution is executed outside the IIS worker process and it is executed within the context of a site collection by a process named SPUCWorkerProcess.exe.
Developer Dashboard
A Developer Dashboard is a debugging information framework in SharePoint. It provides the diagnostic information to troubleshoot issues with page loading and performance.
Resource Quota
Sandboxed Solutions are restricted to a Resource Quota. By default the Resource Quota is 300. It means the Sandboxed Solution can take up to 300 Resource Points per day.
The Test
For the test, we are doing the following:
- Create a Sandboxed Solution
- Add a Visual Web Part
- Include a 10 second delay in the web part render method
- Deploy a Sandboxed Solution
- Add web part to a page
- Enable a Developer Dashboard
- View the Dashboard
- View the Resource Quota usage
Create Sandboxed Solution
Create a new SharePoint project.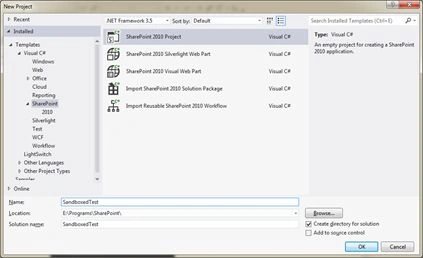
Choose the Sandboxed Solution option.
Add a Visual Web Part
Add a new Visual Web Part.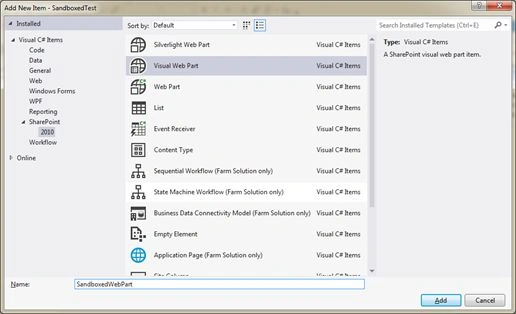
Include 10 second delay
Open the Web Part code file and add a 10 second delay to the Page Load event.
Deploy Sandboxed Solution
Save the solution and deploy.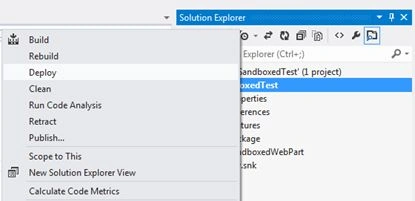
Add Web Part to Page
Now edit your page and add our sandboxed web part. 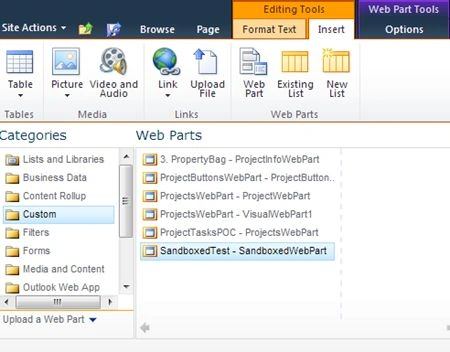
Save changes to the page. Note the 10 second delay involved in rendering the page due to our delay in the web part.
Enable Developer Dashboard
To view the page processing time, we need to enable the Developer Dashboard. Open SharePoint PowerShell and execute the following code.
stsadm -o setproperty -pn developer-dashboard -pv on
If you received the successfully completed message then we are good.
View Developer Dashboard
Now we are ready to view the Developer Dashboard. Open the home page and you can see it to the bottom of the page.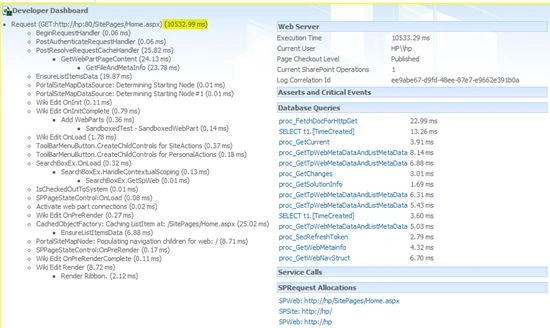
Note the 10 thousand millisecond request processing time and Execution Time (due to the delay in the web part).
The developer dashboard provides the following information:


Join the conversation! Your thoughts help the community grow.