

Pivot Table is a way to quickly summarize data
and information from your database and also an useful way to organize
and present data in your reports.
Usually in SQL server we can use the PIVOT statement in SQL SELECT, something
like this:
SELECT <non-pivoted column>,
[first pivoted column] AS <column name>,
[second pivoted column] AS <column name>,
...
[last pivoted column] AS <column name>
FROM
(<SELECT query that produces the data>)
AS <alias for the source query>
PIVOT
(
<aggregation function>(<column being aggregated>)
FOR
[<column that contains the values that will become column headers>]
IN ( [first pivoted column], [second pivoted column],
... [last pivoted column])
) AS <alias for the pivot table>
<optional ORDER BY clause>;
Imagine to have a classic Northwind database with Orders table, table structure is like this:
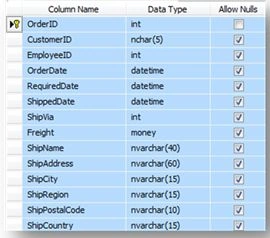
We can build a pivot table with this query:
SELECT ShipCountry AS Countries, [1996], [1997], [1998]
FROM
(SELECT OrderID, ShipCountry, YEAR(OrderDate) AS Years
FROM Orders) ShipsTable
PIVOT
(
COUNT(OrderID)
FOR Years IN ([1996], [1997], [1998])
) AS PivotTable
ORDER BY ShipCountry
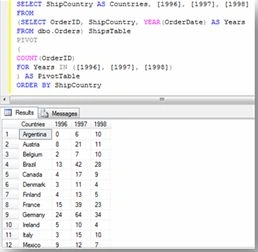
This is the output of the query within management studio:
BUILD THE REPORT
Now we want to explain how to use pivot table within an Entity Model and LINQ syntax, we use the same example above, so you can easily understand differences between the two ways to operate.
The first thing that we must do is to create an empty ASP.NET project, now we can add a default webform called "Default.aspx" and with only a simple panel called "panelPivotTable" in it:
<body>
<asp:Panel ID="panelPivotTable" runat="server">
</asp:Panel>
</body>
In this panel we'll show a table with the representation of the pivot table data. The next thing is to add an Entity Data Model when we'll map the Orders table of Northwind database:
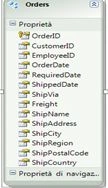
At this point we can write code in the code behind file "Default.aspx.vb", is useful pay particular attention to the part of the code in which we write the SQL Pivot table with LINQ syntax:
Dim query = From g In _
(From o In db.Orders _
Group o By o.ShipCountry Into Group)
Let m1996 As String = (From r In g.Group _
Where r.ShippedDate.Value.Year = "1996" _
Select r.ShipCountry).Count _
Let m1997 As String = (From r In g.Group _
Where r.ShippedDate.Value.Year = "1997" _
Select r.ShipCountry).Count _
Let m1998 As String = (From r In g.Group _
Where r.ShippedDate.Value.Year = "1998" _
Select r.ShipCountry).Count _
Select New With { _
.Country = g.ShipCountry, _
.y1996 = m1996, _
.y1997 = m1997, _
.y1998 = m1998 _
}
What we are doing is to make a query grouped
by ShipCountry field, the keyword "Let" is an useful way to storing the results
of a query in a new variable initialized with the result of the expression, so
in our example we are storing in String variable
m1996
the result of query "(From
r In g.Group r.ShippedDate.Value.Year =
"1996" Select
r.ShipCountry).Count" and so on
for the others years.
Then we retrieve the valorized values in new variables within Select New statement, you can notice that the variables (ex. .Country, .y1996 etc.) have a dot before the name, this dot is needed when we create new customized fields in a Select statement. Now that we know how to retrieve a pivot table from our database we can build the report we can loop through data and write values in a table.
For Each item In query
row = New TableRow
cell = New TableCell
cell.Text = item.Country
row.Cells.Add(cell)
...........
table.Rows.Add(row)
Next
panelPivotTable.Controls.Add(table)
And this is the result of our work:
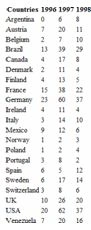
I hope that this tutorial will help you in development of easy little reports as you can see in the attached source project.
Join the conversation! Your thoughts help the community grow.