

In Part 1, we saw how to install and begin using the SP Diagnostics Tool. In this article we will see some more reports that this tool provides to diagnose issues in SharePoint.
ULS Trace Issues
This is another important report that lists all the issues found in the logs. You can sort the Process-wise messages and troubleshoot individually.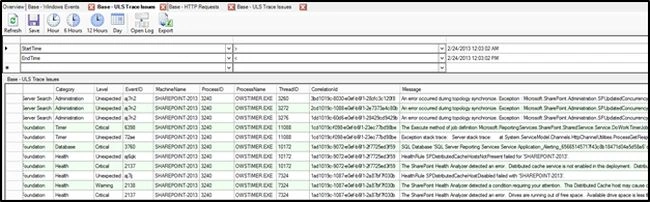
Figure 9: SP Diagnostics: ULS Trace Issues Report
SQL Overview Report
The SQL Overview Report is another important one. It gives details of the locks if any and waiting period for SQL read/writes as database latency is one important factor in performance optimization.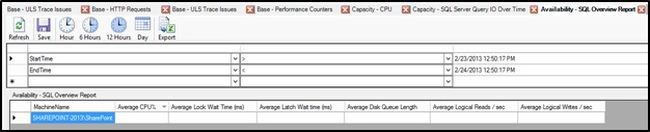
Figure 10: SP Diagnostics: SQL Overview Report
In case the Performance Diagnostics providers have not been provisioned you will get the message as below.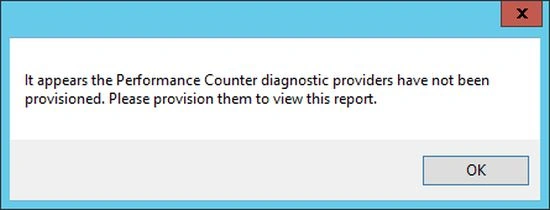
In case these counters are provisioned you will get the details in these reports.
SQL Server Locking/Blocking
SQL Server query blocking can increase some SQL Server query duration values, and might contribute to availability issues and increased latency.
- Average Lock Wait Time Locks: held on SQL Server resources, such as rows read or modified during a transaction, to prevent concurrent use of resources by multiple transactions. For example, an update will hold an XLOCK and it will block a shared read lock. A high lock wait time means there is a blocking issue in the SQL Server tier, and you should pay attention to slow updating threads, as they will block reads.
- Average Latch Wait Time: A latch is primarily used to synchronize database pages. Each latch is associated with a single allocation unit. A latch wait occurs when a latch request cannot be granted immediately because the latch is held by another thread in a conflicting mode. Unlike locks, a latch is released immediately after the operation, even in write operations. High latch wait time might means that it is taking too long to load a specific page into memory.
When Lock Wait Time is high, examine the SQL Blocking report to identify the queries holding the locks.
You can examine the SQL Deadlocks report to identify queries that might have generated failed requests.
SQL Server Disk IO
A common SQL Server performance issue is an I/O bottleneck. When SQL Server does not have sufficient I/O bandwidth to process incoming queries, performance across all requests will decrease, and performance across all farm Web servers will be decreased.
- Average Disk Queue Length: This metric is for overall Disk I/O. Higher values translate to increased overall I/O pressure, and if you have more than 10, it is possible there is an I/O bottleneck.
- Average Logical Reads / s: This metric is for the Read Disk I/O. Higher values translate to increased Read I/O pressure.
- Average Logical Writes / s: This metric is for the Write Disk I/O. Higher values translate to increased Write I/O pressure.
When there is an I/O bottleneck, examine the SQL Read-Intensive Traces report to see what specific queries are consuming the most resources.
Performance Reports
The Performance section has important reports that give graphs on the details of specific farm performance indicators related to latency and SQL Server. But reports in this section are snapshots of how long it took or how many locks occurred rather than the issues and problematic areas. 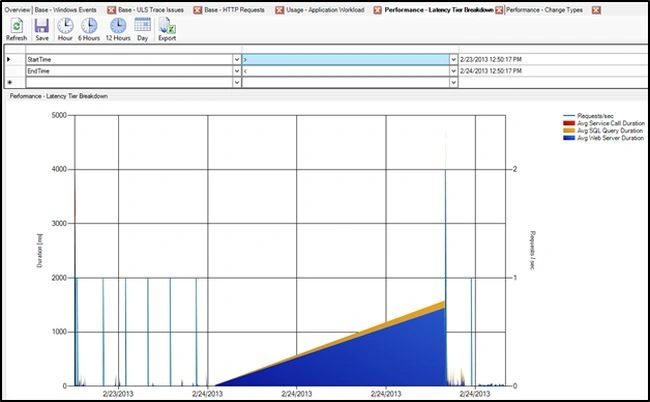
Figure 11: SP Diagnostics: Performance Report
We have seen how these built-in reports help us to diagnose issues in SharePoint production environments. But you need to bear in mind that this tool should be run when there is less load on the system or over the weekends. Snapshots of the entire data can be saved for reporting later; we will see that in Part 3 of the article.
Join the conversation! Your thoughts help the community grow.