

RadBulletGraph control is a replacement for dashboard gauges and meters. The RadBulletGraph features a single measure that is compared to one or more other measures to enrich its meaning (for example, compared to a target), and displays results in the context of qualitative ranges of performance, such as poor, satisfactory, and good. More details are here: Telerik RadBulletGraph.
In reading this article, you will learn how to use Telerik RadBulletGraph Control in Universal Windows Apps development with XAML and Visual C#.
The following important tools are required for developing UWP,
- Windows 10 (Recommended)
- Visual Studio 2017 RC Community/Enterprise/Professional Edition (It is a Free trial software available online)
Step1

After Choosing the Target and minimum platform version your Windows Universal Application will support and the Project creates App.xaml and MainPage.xaml.

Step 2
Open (double Click) the file MainPage.xaml in the Solution Explorer and add the Telerik.UI.for.UniversalWindowsPlatform reference in the project.
For adding Reference, RightClick Your Project (UWPTelBulletGraph) and Select Manage Nuget Packages. Choose Browse and Search Telerik.UI.for.UniversalWindowsPlatform select the package and install it.

Reference added to your project

Step 3
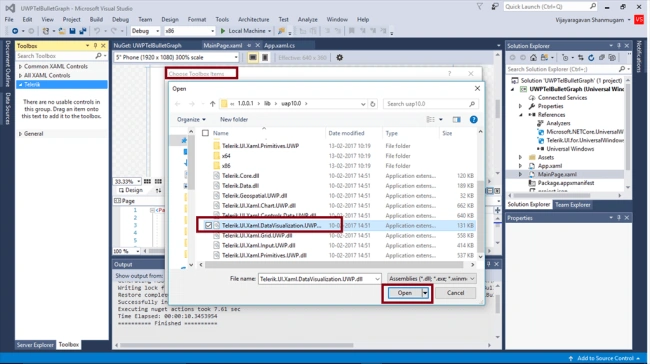
Add tab named Telerik in the Toolbox, for adding Telerik.UI.for.UniversalWindowsPlatform BulletGraph controls
Right click the Telerik (Newly added tab) and Select choose items
Select the path, C:\Users\<username>\.nuget\packages\telerik.ui.for.universalwindowsplatform\1.0.0.1\lib\uap10.0 and select the file Telerik.UI.Xaml.DataVisualization.UWP.dll


Step 4
Next, add TextBlock and 4 RadBulletGraph Controls with different properties
Add TextBlock control and change the Name and text property for title,

Add TextBlock control and change the Name and text property for Simple RadBulletGraph,

Now, add the RadBulletGraph Control and set the name property


Add TextBlock control and change the Name and text property for RadBulletGraph - Scaling Labels and Ticks and add the RadBulletGraph Control and set the name, TickStep, LabelStep, properties


Automatically the following code will be generated in XAML code view, while we are done in the design view.
- <Page xmlns="http://schemas.microsoft.com/winfx/2006/xaml/presentation" xmlns:x="http://schemas.microsoft.com/winfx/2006/xaml" xmlns:local="using:UWPTelBulletGraph" xmlns:d="http://schemas.microsoft.com/expression/blend/2008" xmlns:mc="http://schemas.openxmlformats.org/markup-compatibility/2006" xmlns:DataVisualization="using:Telerik.UI.Xaml.Controls.DataVisualization" x:Class="UWPTelBulletGraph.MainPage" mc:Ignorable="d" Margin="0,-3,0,3">
- <Grid x:Name="RBG_QI" Background="{ThemeResource ApplicationPageBackgroundThemeBrush}">
- <TextBlock x:Name="TblTitle" HorizontalAlignment="Left" Margin="132,-2,0,0" TextWrapping="Wrap" Text="Telerik RadBulletGraph control in UWP " VerticalAlignment="Top" FontWeight="Bold" FontSize="20" Width="380" />
- <TextBlock x:Name="tblSimp" HorizontalAlignment="Left" Margin="25,22,0,0" TextWrapping="Wrap" Text="Simple RadBulletGraph" VerticalAlignment="Top" Width="207" />
- <DataVisualization:RadBulletGraph x:Name="RBGSimple" HorizontalAlignment="Left" Margin="42,43,0,0" VerticalAlignment="Top" Height="48" Width="514" />
- <TextBlock HorizontalAlignment="Left" Margin="21,93,0,0" TextWrapping="Wrap" Text="RadBulletGraph - Reverse Scale" VerticalAlignment="Top" Width="402" />
- <DataVisualization:RadBulletGraph x:Name="RBGRev" Orientation="Horizontal" HorizontalAlignment="Left" Margin="42,118,0,0" VerticalAlignment="Top" Height="52" FeaturedMeasureStartValue="0" EndValue="175" TickStep="25" LabelStep="25" LabelOffset="15" FeaturedMeasure="50" ComparativeMeasure="100" Width="570" />
- <TextBlock HorizontalAlignment="Left" Margin="21,170,0,0" TextWrapping="Wrap" Text="RadBulletGraph - Scaling Labels and Ticks" VerticalAlignment="Top" Width="402" />
- <DataVisualization:RadBulletGraph x:Name="RBGScLT" LabelStep="15" TickStep="25" HorizontalAlignment="Left" Margin="28,195,0,0" VerticalAlignment="Top" Height="45" Width="584" />
- <TextBlock HorizontalAlignment="Left" Margin="21,240,0,0" TextWrapping="Wrap" Text="RadBulletGraph - Qulitative Indicators" VerticalAlignment="Top" Width="402" />
- <DataVisualization:RadBulletGraph x:Name="RBGQI" HorizontalAlignment="Left" EndValue="100" Margin="28,251,0,0" VerticalAlignment="Top" Height="85" Width="584">
- <DataVisualization:BarIndicatorSegment x:Name="BISRed" Stroke="Red" Thickness="20" Length="30" />
- <DataVisualization:BarIndicatorSegment x:Name="BISOrange" Stroke="Orange" Thickness="20" Length="30" />
- <DataVisualization:BarIndicatorSegment x:Name="BISYellow" Stroke="Yellow" Thickness="20" Length="30" /> </DataVisualization:RadBulletGraph>
- </Grid>
- </Page>
Step 5
Deploy your App in Local Machine, and the output of the UWPTelBulletGraph App is,

Summary
Now you have successfully tested Telerik RadBulletGraph control in Visual C# - UWP environment in Visual Studio 2017 RC.
Join the conversation! Your thoughts help the community grow.