

Introduction
The basics concepts of data science can be separated into two important parts. Some people may argue with me because I have to tell you supervised learning and unsupervised learning and decision tree algorithms. But my intention is not to explain the concepts of Data Science. This article is related to knowledge about who wants to be started as a data scientist.
The basic concepts of Data Science can be separated into two parts.
- Regression
- Classification
Why we have to learn these two concepts? The first reason is that we have to model the relationship between two variables by fitting a linear equation. And Classification is a method of classification for the data. The classifier is used for classification.
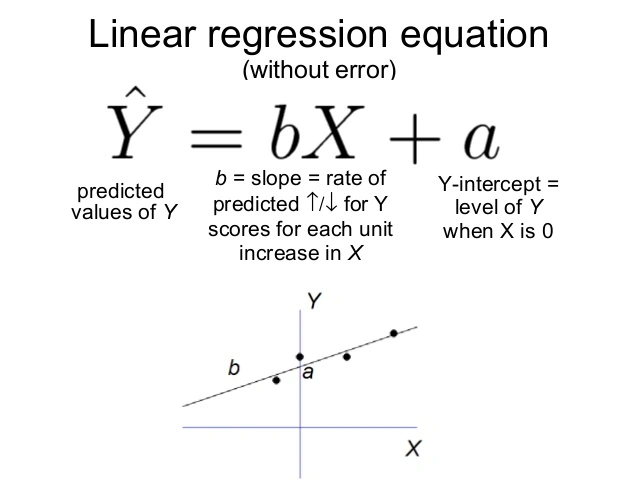
A linear regression line has an equation of the form Y = b*X+a, where X is the explanatory variable and Y is the dependent variable. The slope of the line is b, and “a” is the intercept.
How can I make it by NumPy?
As I mentioned before, Linear regression attempts to model the relationship between two variables by fitting a linear equation to the observed data. One variable is considered to be an explanatory variable, and the other is considered to be a dependent variable. For example, a modeler might want to relate the weights of individuals to their heights using a linear regression model.
(http://www.stat.yale.edu/Courses/1997-98/101/linreg.htm)
- import numpy as np
- import pandas as pd
- import matplotlib.pyplot as plt# C: \pybook\ Data\ LinearRegressionDataSet.csv
- data = pd.read_csv("C:\pybook\Data\LinearRegressionDataSet.csv")
- print(data)
- x = data["X"]
- y = data["Y"]
- x = pd.DataFrame.as_matrix(x)
- y = pd.DataFrame.as_matrix(y)
- print(x)
- print(y)
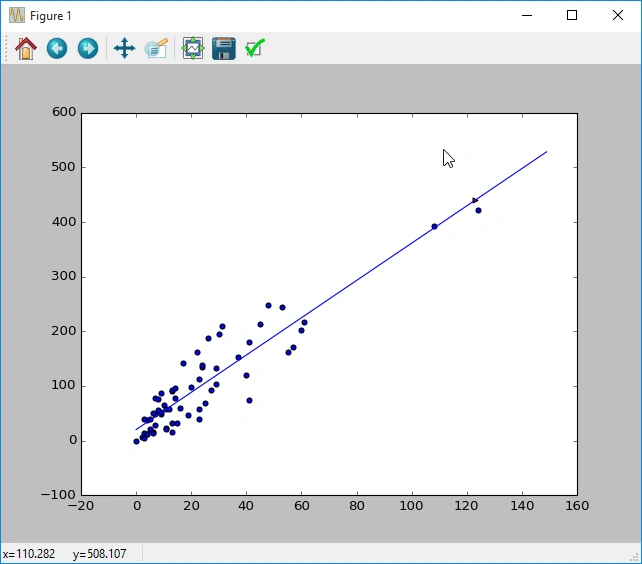
- m, b = np.polyfit(x, y, 1)
- a = np.arange(150)
- plt.scatter(x, y)
- plt.plot(m * a + b)
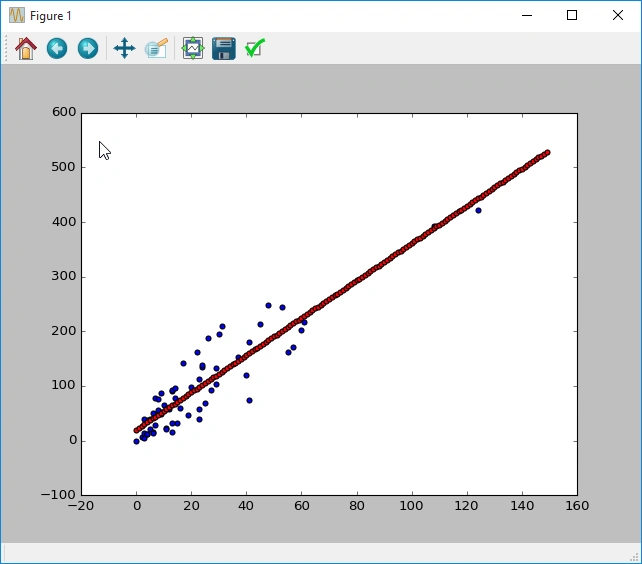
- z = int(input("X value ?"))
- prediction = m * z + b
- print(prediction)
- print("y=", m, "x+", b)
- plt.scatter(z, prediction, c = "red", marker = ">")
- plt.show()
What is NumPy?
Numpy is a kind of scientific library for a Python developer who wants to write a functional scientific program. With the help of NumPy, you don’t have to develop software from zero to advanced level.
What are pandas?
Pandas is a software library written in the Python programming language for data manipulation and analysis. Generally, it is used for reading data from CSV resources.
What is matplotlib?
Matplotlib is a plotting library for the Python programming language and its numerical mathematics extension NumPy. It provides an object-oriented API for embedding plots into applications using general-purpose GUI toolkits like Tkinter, wxPython, Qt, or GTK+.
Sajid HussainPosted Sep 12, 2017, 7:06 AM
Healthy contribution for myself!!!!