

Background
Sometimes we need to show the information like steps to visualize the data for better interactivity. So Today we will discuss the ThreeLineBreak type chart of ASP.Net which will show the data with line breaks. So let us start to learn about this chart type control step-by-step.
Now let us learn about the properties of the ThreeLineBreak charts. A ThreeLineBreak chart type has the following common properties:
- AlternetText: Sets the alternate text when the image is not available.
- Annotation: Stores the chart annotations.
- AntiAliasing: Sets a value that determines whether anti-aliasing is used when text and graphics are drawn.
- BackGradientStyle: Sets the orientation for the background gradient for the Chart control. Also determines whether a gradient is used, the default is None.
- Backcolor: Sets the background color for a chart, the default color is White.
- BackImage: Sets the background image for the chart control.
- BackHatchStyle: Sets the hatching style for the chart control, the default is None.
- Height: Sets the height for the chart control.
- Width: Sets the width for the chart control.
- Palette: Sets the style with the color for the chart control, the default style is Chocolate.
- PaletteCustomColors: Sets the custom color for the chart control.
- Series: Sets the series collection for the chart control.
- Legends: Sets the series of legends to the chart.
Now let us show the preceding explanation with a practical example by creating a simple web application.
Step 1
Use the following script to create a table for the chart data:
CREATE TABLE [dbo].[orderdet](
    [id] [int] IDENTITY(1,1) NOT NULL,
    [Month] [varchar](50) NULL,
    [Orders] [int] NULL,
 CONSTRAINT [PK_Order Table] PRIMARY KEY CLUSTERED
(
    [id] ASC
)WITH (PAD_INDEX = OFF, STATISTICS_NORECOMPUTE = OFF, IGNORE_DUP_KEY = OFF, ALLOW_ROW_LOCKS = ON, ALLOW_PAGE_LOCKS = ON) ON [PRIMARY]
) ON [PRIMARY]
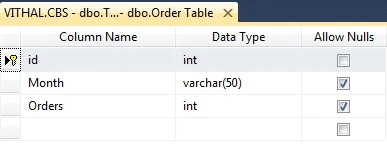
Now the design will look as follows:
Now insert the records using the following script:
SET IDENTITY_INSERT [dbo].[orderdet] ON
GO
INSERT [dbo].[orderdet] ([id], [Month], [Orders]) VALUES (1, N'Jan', 0)
GO
INSERT [dbo].[orderdet] ([id], [Month], [Orders]) VALUES (2, N'Feb', 5)
GO
INSERT [dbo].[orderdet] ([id], [Month], [Orders]) VALUES (3, N'March', 20)
GO
INSERT [dbo].[orderdet] ([id], [Month], [Orders]) VALUES (4, N'April', 40)
GO
INSERT [dbo].[orderdet] ([id], [Month], [Orders]) VALUES (5, N'May', 15)
GO
INSERT [dbo].[orderdet] ([id], [Month], [Orders]) VALUES (6, N'Jun', 60)
GO
INSERT [dbo].[orderdet] ([id], [Month], [Orders]) VALUES (7, N'July', 75)
GO
INSERT [dbo].[orderdet] ([id], [Month], [Orders]) VALUES (8, N'Aug', 80)
GO
INSERT [dbo].[orderdet] ([id], [Month], [Orders]) VALUES (9, N'Sep', 85)
GO
INSERT [dbo].[orderdet] ([id], [Month], [Orders]) VALUES (10, N'Oct', 100)
GO
INSERT [dbo].[orderdet] ([id], [Month], [Orders]) VALUES (11, N'Nov', 2)
GO
INSERT [dbo].[orderdet] ([id], [Month], [Orders]) VALUES (12, N'Dec', 90)
GO
SET IDENTITY_INSERT [dbo].[orderdet] OFF
Go
After running the preceding script the records in the table will look as follows:

Step 2
Create a Stored Procedure to fetch the records from the database.
Create procedure [dbo].[GetCharData]
(
@id int =null
)
as
begin
Select Month,Orders from Orderdet
End
Step 3
Create a Web Application. Create the website with:
- "Start" - "All Programs" - "Microsoft Visual Studio 2010".
- "File" - "New Project" - "C#" - "Empty Website" (to avoid adding a master page).
- Provide the project a name such as "ThreeLineBreak" or another as you wish and specify the location.
- Then right-click on the Solution Explorer and select "Add New Item" then select Default.aspx page.
- Drag and Drop a Chart control from the ToolBox onto the Default.aspx page.
Now the Default.aspx source code will be as follows:
<%@ Page Language="C#" AutoEventWireup="true" CodeFile="Default.aspx.cs" Inherits="_Default" %>
<%@ Register Assembly="System.Web.DataVisualization, Version=4.0.0.0, Culture=neutral, PublicKeyToken=31bf3856ad364e35"
    Namespace="System.Web.UI.DataVisualization.Charting" TagPrefix="asp" %>
<!DOCTYPE html PUBLIC "-//W3C//DTD XHTML 1.0 Transitional//EN" "http://www.w3.org/TR/xhtml1/DTD/xhtml1-transitional.dtd">
<html xmlns="http://www.w3.org/1999/xhtml">
<head runat="server">
    <title>Article by Vithal Wadje</title>
</head>
<body bgcolor="blue">
    <form id="form1" runat="server">
    <h4 style="color: White;">
        Article for C#Corner
    </h4>
    <asp:Chart ID="Chart1" runat="server" BackColor="128, 64, 0" BackGradientStyle="LeftRight"
        BorderlineWidth="0" Height="340px" Palette="None" PaletteCustomColors="192, 0, 192"
        Width="360px" BorderlineColor="128, 64, 0">
        <Series>
            <asp:Series Name="Series1"  YValuesPerPoint="12" ChartType="ThreeLineBreak">
            </asp:Series>
        </Series>
        <ChartAreas>
            <asp:ChartArea Name="ChartArea1">
            </asp:ChartArea>
        </ChartAreas>
    </asp:Chart>
    </form>
</body>
</html>
Step 4
Create a method to bind the chart control.
Now, open the default.aspx.cs page and create the following function named Bindchart to bind the Chart Control as in the following:
private void Bindchart()
{
    connection();
    com = new SqlCommand("GetCharData", con);
    com.CommandType = CommandType.StoredProcedure;
    SqlDataAdapter da = new SqlDataAdapter(com);
    DataSet ds = new DataSet();
    da.Fill(ds);
    DataTable ChartData = ds.Tables[0];
    //storing total rows count to loop on each Record
    string[] XPointMember = new string[ChartData.Rows.Count];
    int[] YPointMember = new int[ChartData.Rows.Count];
    for (int count = 0; count < ChartData.Rows.Count; count++)
    {
        //storing Values for X axis
        XPointMember[count] = ChartData.Rows[count]["Month"].ToString();
        //storing values for Y Axis
        YPointMember[count] = Convert.ToInt32(ChartData.Rows[count]["Orders"]);
    }
    //binding chart control
    Chart1.Series[0].Points.DataBindXY(XPointMember, YPointMember);
    //Setting width of line
    Chart1.Series[0].BorderWidth = 3;
    //setting Chart type
    Chart1.Series[0].ChartType = SeriesChartType.ThreeLineBreak;
    //Hide or show chart back GridLines
    //  Chart1.ChartAreas["ChartArea1"].AxisX.MajorGrid.Enabled = false;
    //  Chart1.ChartAreas["ChartArea1"].AxisY.MajorGrid.Enabled = false;
    //Enabled 3D
    //Chart1.ChartAreas["ChartArea1"].Area3DStyle.Enable3D = true;
    con.Close();
}
Now, call the preceding function on page load as in the following:
protected void Page_Load(object sender, EventArgs e)
{
    if (!IsPostBack)
    {
        Bindchart();
    }
}
The entire code of the default.aspx.cs page will look as follows:
using System;
using System.Collections.Generic;
using System.Linq;
using System.Web;
using System.Web.UI;
using System.Web.UI.WebControls;
using System.Data.SqlClient;
using System.Configuration;
using System.Data;
using System.Web.UI.DataVisualization.Charting;

public partial class _Default : System.Web.UI.Page
{
    private SqlConnection con;
    private SqlCommand com;
    private string constr, query;
    private void connection()
    {
        constr = ConfigurationManager.ConnectionStrings["getconn"].ToString();
        con = new SqlConnection(constr);
        con.Open();
    }
    protected void Page_Load(object sender, EventArgs e)
    {
        if (!IsPostBack)
        {
            Bindchart();
        }
    }
    private void Bindchart()
    {
        connection();
        com = new SqlCommand("GetCharData", con);
        com.CommandType = CommandType.StoredProcedure;
        SqlDataAdapter da = new SqlDataAdapter(com);
        DataSet ds = new DataSet();
        da.Fill(ds);
        DataTable ChartData = ds.Tables[0];
        //storing total rows count to loop on each Record
        string[] XPointMember = new string[ChartData.Rows.Count];
        int[] YPointMember = new int[ChartData.Rows.Count];
        for (int count = 0; count < ChartData.Rows.Count; count++)
        {
            //storing Values for X axis
            XPointMember[count] = ChartData.Rows[count]["Month"].ToString();
            //storing values for Y Axis
            YPointMember[count] = Convert.ToInt32(ChartData.Rows[count]["Orders"]);
        }
        //binding chart control
        Chart1.Series[0].Points.DataBindXY(XPointMember, YPointMember);
        //Setting width of line
        Chart1.Series[0].BorderWidth = 3;
        //setting Chart type
        Chart1.Series[0].ChartType = SeriesChartType.ThreeLineBreak;
        //Hide or show chart back GridLines
        //  Chart1.ChartAreas["ChartArea1"].AxisX.MajorGrid.Enabled = false;
        //  Chart1.ChartAreas["ChartArea1"].AxisY.MajorGrid.Enabled = false;
        //Enabled 3D
        //Chart1.ChartAreas["ChartArea1"].Area3DStyle.Enable3D = true;
        con.Close();
    }
}
Now, we have the entire logic to bind the chart from the database. Let us run the application, then the ThreeLineBreak Chart will look as follows:

Now change the Border width nd color as:
//Setting width of line
Chart1.Series[0].BorderWidth = 4;
Now the ThreeLineBreak will look as follows:

Now let us hide the Grid Lines as in the following:
//Hide or show chart back GridLines
Chart1.ChartAreas["ChartArea1"].AxisX.MajorGrid.Enabled = false;
Chart1.ChartAreas["ChartArea1"].AxisY.MajorGrid.Enabled = false;
Now the ThreeLineBreak chart will be as follows:

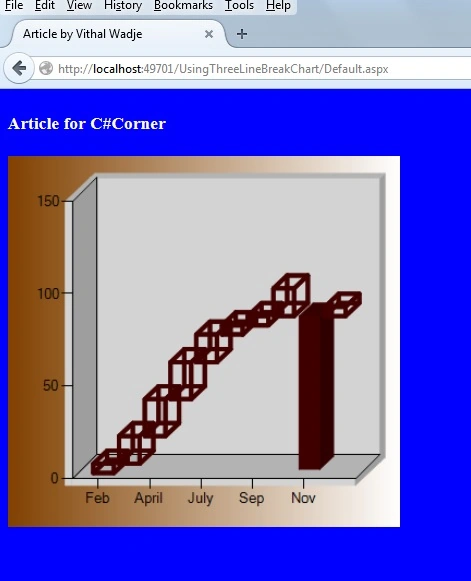
The preceding is the normal ThreeLineBreak chart. Now let us enable the 3D style as in the following:
//Enabled 3D
Chart1.ChartAreas["ChartArea1"].Area3DStyle.Enable3D = true;
Now the 3D style ThreeLineBreak chart will be as:
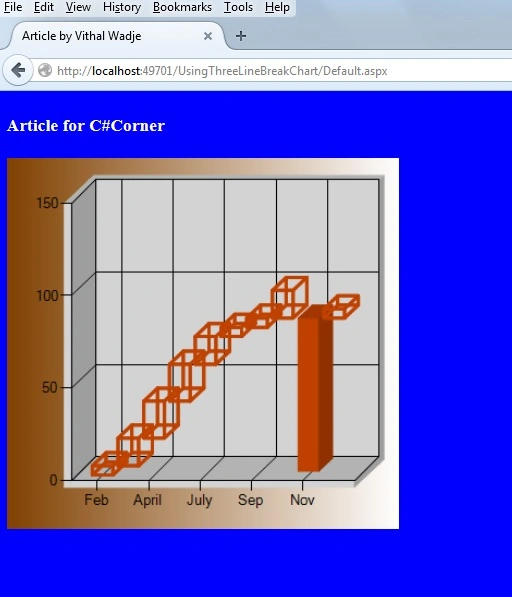
Now let us limit the Border width as compared to the preceding:
//Setting width of line
Chart1.Series[0].BorderWidth = 4;
Now the ThreeLineBreak chart will look as follows:
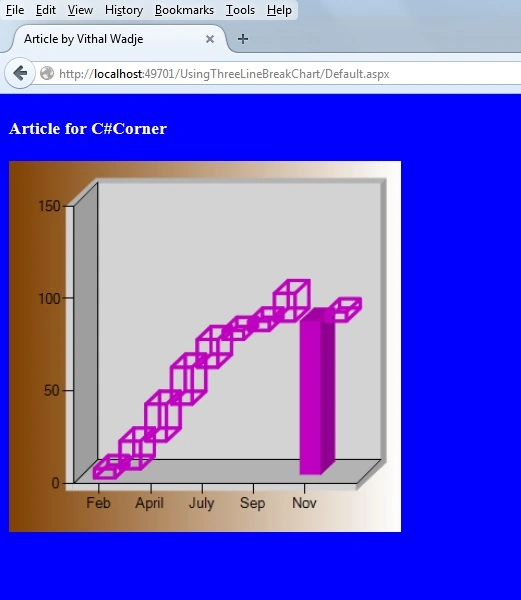
You can also change the Palette Colors depending on your needs. I will change the Palette color. Now the chart will look as follows:
Now from all the preceding explanations we saw how to create and use a ThreeLineBreak type chart.
Notes
- Download the Zip file from the attachment for the full source code of the application.
- Change the connection string in the web.config file to specify your server location.
Summary
My next article explains another chart type of ASP.Net. I hope this article is useful for all readers, if you have any suggestion then please contact me including beginners also.
Join the conversation! Your thoughts help the community grow.