

Introduction
In real-world projects, data rarely comes in a perfect format. Sometimes:
Months are spread across columns
Categories are stored horizontally
Data needs restructuring before analysis
This is where Pivot and Unpivot in Power BI (Power Query Editor) become extremely powerful.
In this article, we’ll understand:
What Pivot is
What Unpivot is
Difference between them
Real business example
Step-by-step practical implementation
Performance Tip and Common Mistakes to avoid.
What is Unpivot in Power BI?
Unpivot converts columns into rows.
It transforms wide-format data into normalized (long) format.
Business Scenario Example
You receive sales data like this:
| Product | Jan | Feb | Mar |
|---|---|---|---|
| A | 100 | 120 | 130 |
| B | 200 | 210 | 220 |
This format looks fine in Excel — but for Power BI analysis, it’s not ideal.
We need it like this:
| Product | Month | Sales |
|---|---|---|
| A | Jan | 100 |
| A | Feb | 120 |
| A | Mar | 130 |
| B | Jan | 200 |
| B | Feb | 210 |
| B | Mar | 220 |
This transformation is called Unpivoting.
Practical Steps: How to Unpivot in Power BI
Step 1: Load the CSV File
Open Power BI Desktop
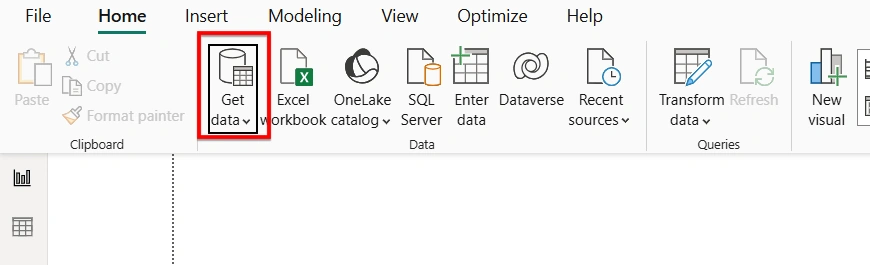
Click Home → Get Data → Text/CSV
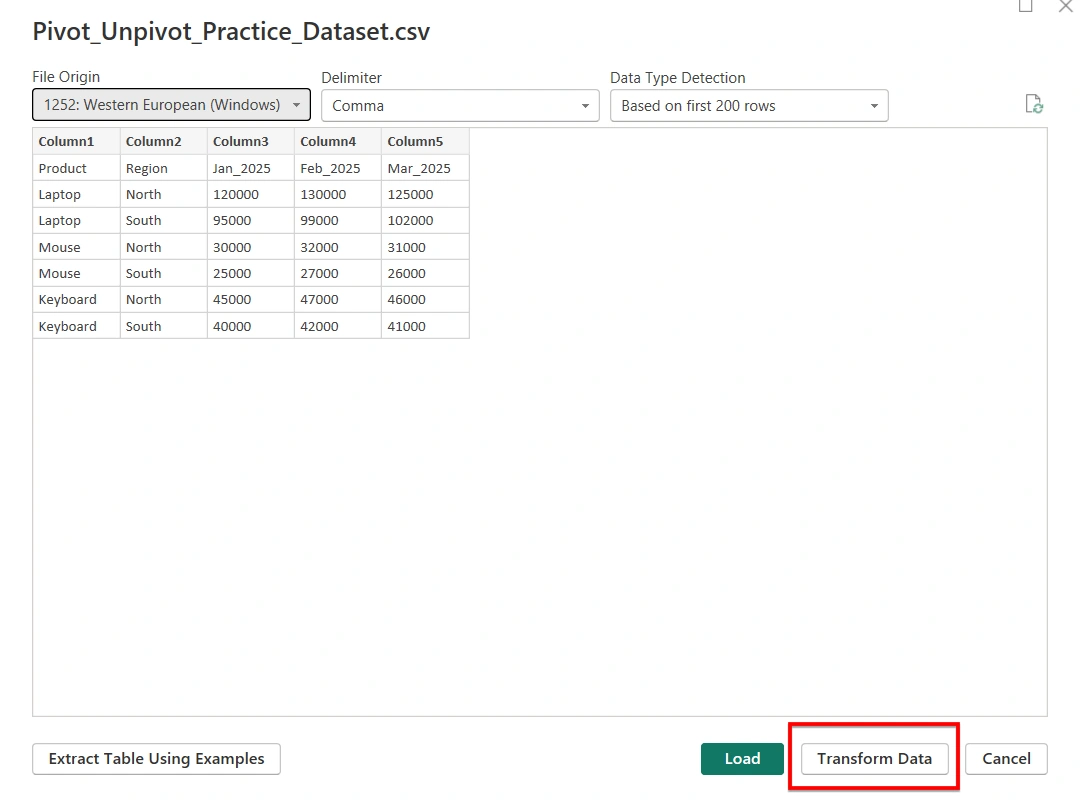
Select your file . (Eg:
Pivot_Unpivot_Practice_Dataset.csv)Click Transform Data
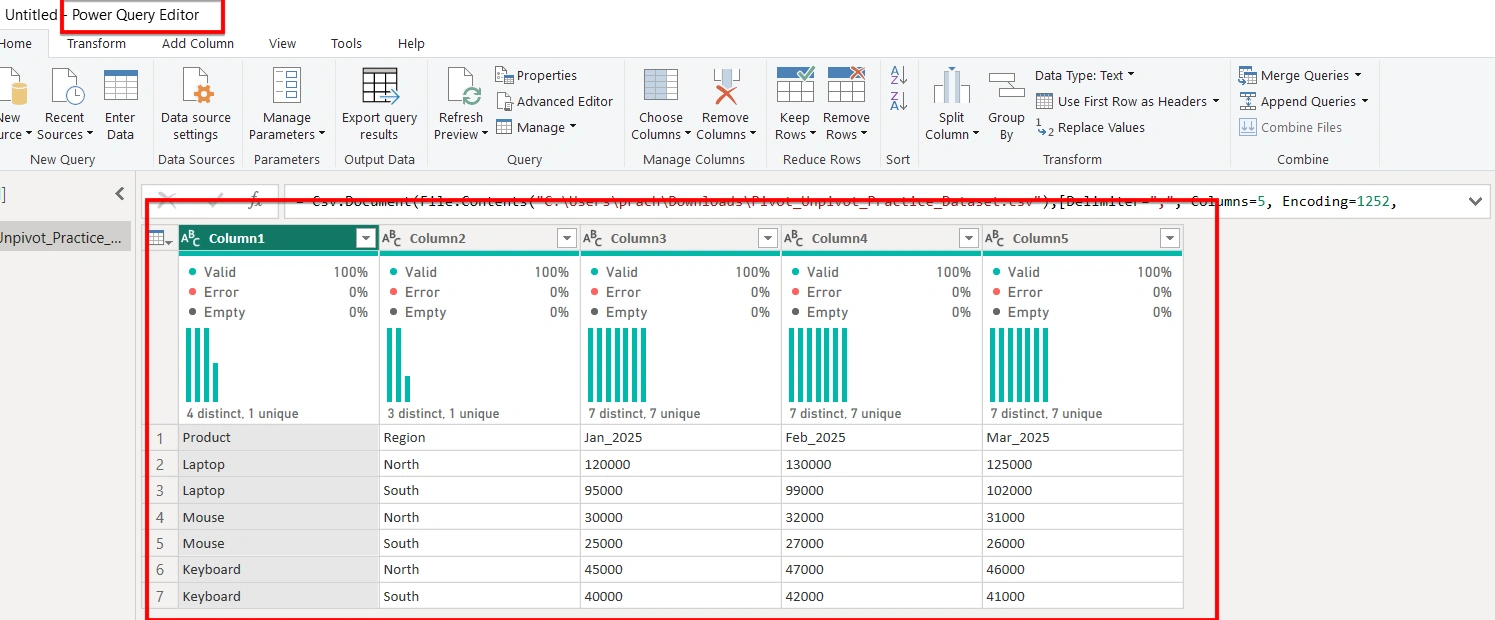
Power Query Editor will open.
Step 2: Identify Fixed Columns
In our dataset:
Product
Region
These should remain unchanged.
The month columns:
Jan_2025
Feb_2025
Mar_2025
These need to be unpivoted.
Step 3: Unpivot the Month Columns
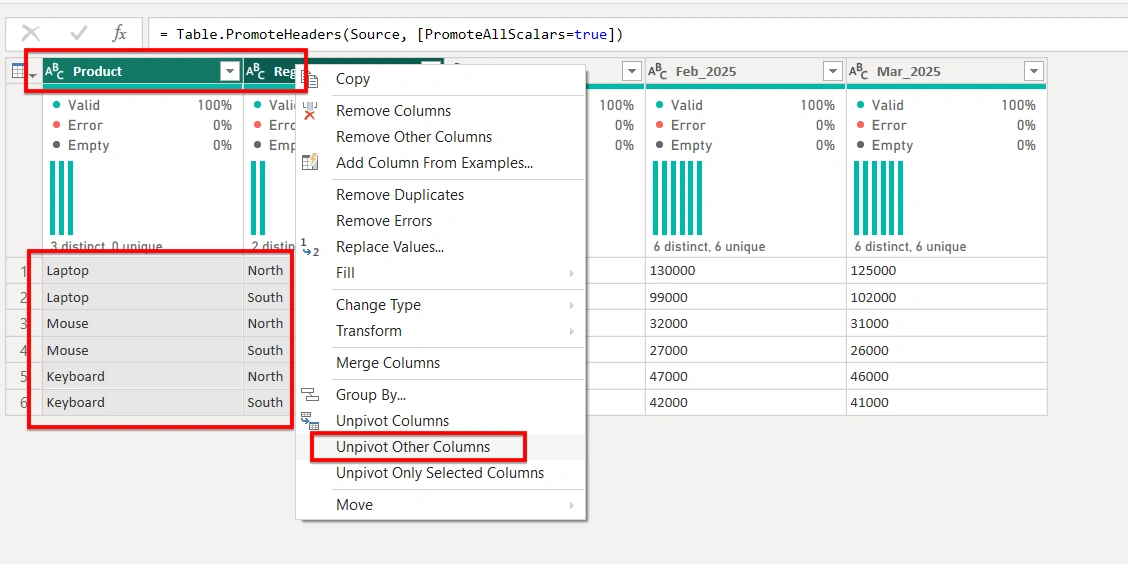
Option 1 (Recommended Method):
Select Product and Region
Go to Transform Tab
Click Unpivot Columns → Unpivot Other Columns
OR
Option 2:
Select Jan_2025, Feb_2025, Mar_2025
Right-click
Choose Unpivot Columns
Step 4: Rename Columns
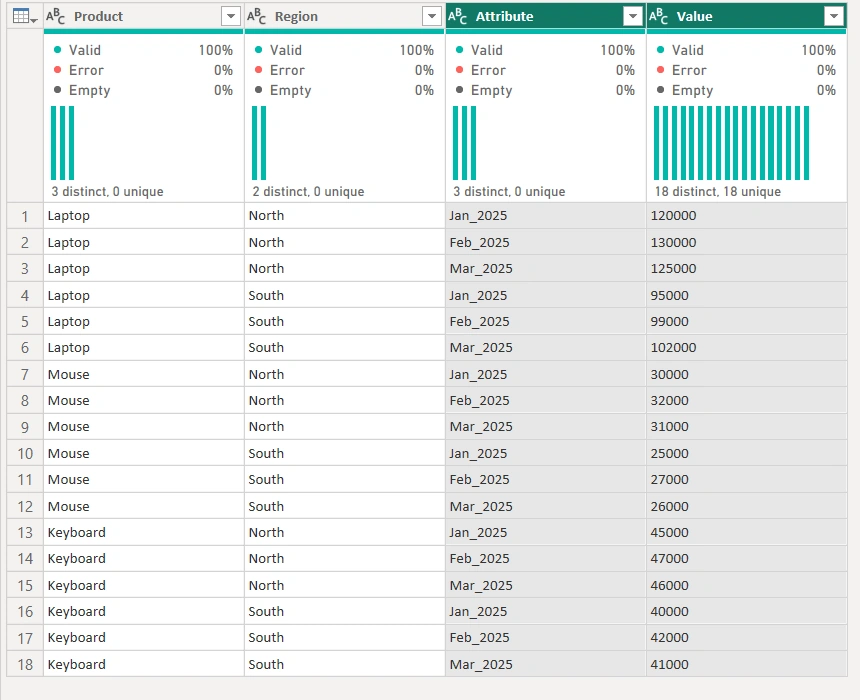
After unpivoting, Power BI creates:
Attribute → Rename to Month
Value → Rename to Sales
What is Pivot in Power BI?
Pivot does the opposite of Unpivot.
It converts row values into columns.
It transforms long-format data into wide format.
Example (Reverse Scenario)
If your data is:
| Product | Month | Sales |
|---|---|---|
| A | Jan | 100 |
| A | Feb | 120 |
| A | Mar | 130 |
You may want:
| Product | Jan | Feb | Mar |
|---|---|---|---|
| A | 100 | 120 | 130 |
This is called Pivoting.
Practical Steps: How to Pivot in Power BI
Step 1: Go Back to Power Query
Click:
Home → Transform Data
Step 2: Select Column to Pivot
Click the Product column.
Step 3: Click Pivot Column
Go to Transform Tab
Click Pivot Column
A popup appears.
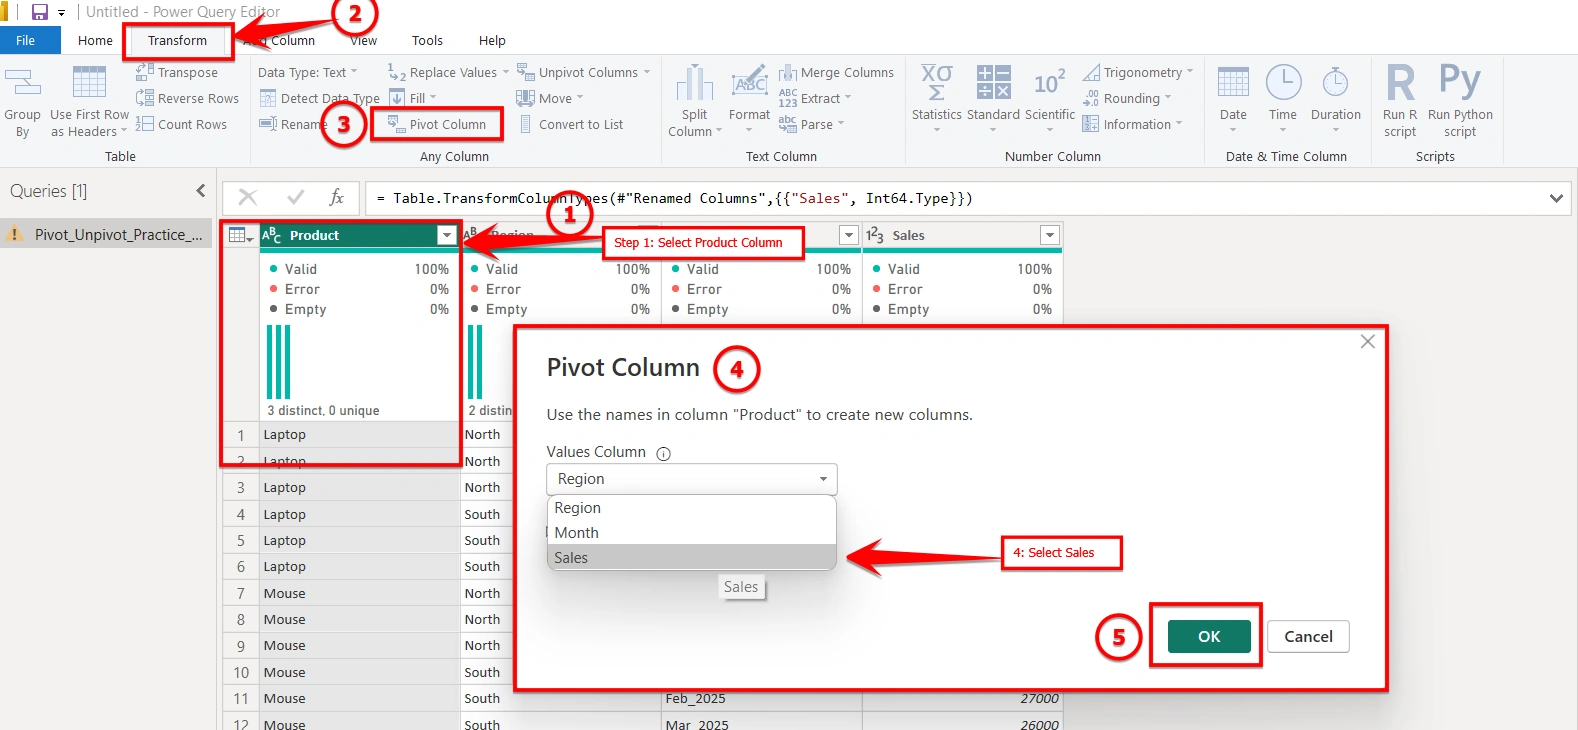
Step 4: Choose Values Column
In the popup:
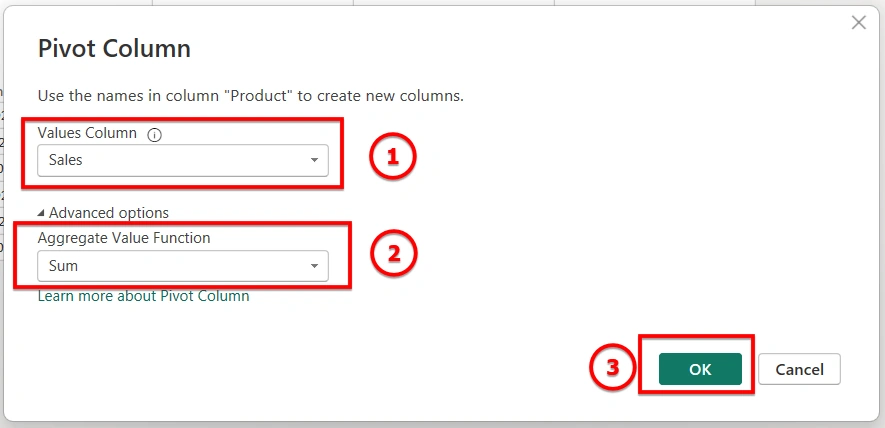
Values Column → Select Sales
Aggregation → Choose Sum (or Don't Aggregate if unique)
Click OK.
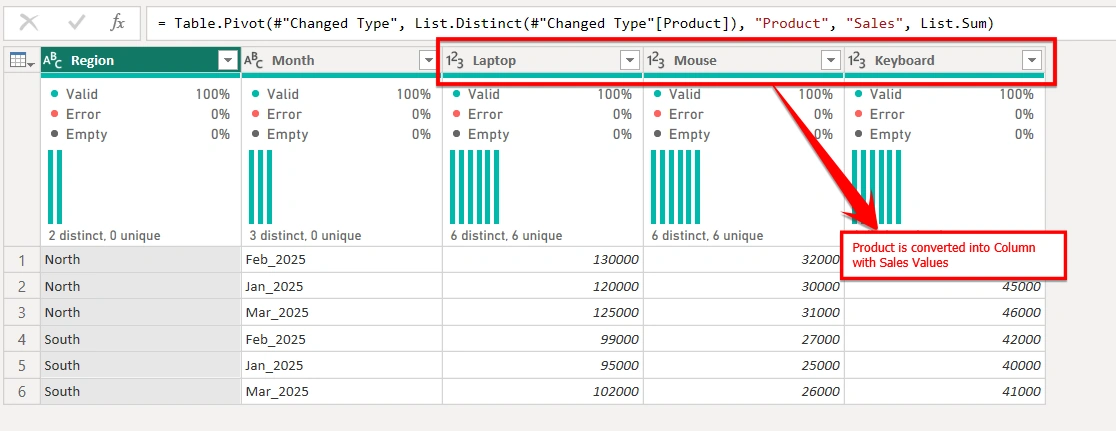
Step 5: Result
Now your data will be converted into column format.
Click Home Tab -> Close & Apply.
Pivot vs Unpivot – Key Differences
| Feature | Pivot | Unpivot |
|---|---|---|
| Converts | Rows → Columns | Columns → Rows |
| Used When | Creating summary format | Normalizing data |
| Best For | Export/Presentation | Data Modeling |
| Common Use Case | Matrix-style reports | Time Intelligence |
Performance Tip
Always perform: Pivot / Unpivot in Power Query - Not using DAX
Because:
Power Query transformations happen during data load
DAX increases model complexity.
Common Mistakes to avoid
Not analyzing and performing the datatype change step for all columns.
(eg. Sales column [Datatype is to be set as: Whole Number])Unpivoting key columns accidentally
Pivoting without selecting proper aggregation (in pop - up)
Forgetting to rename "Attribute" and "Value" columns
Creating relationships before cleaning structure
Conclusion
Pivot and Unpivot are fundamental data transformation techniques in Power BI that help reshape data into analysis-ready formats. Mastering these concepts ensures your data model remains clean, scalable, and optimized for powerful reporting and time intelligence calculations.
Join the conversation! Your thoughts help the community grow.