

Introduction
Here we will discuss the intervals. Intervals are nothing new, it is just a type of Google Chart that also represents data. In simple words I will say that intervals play a major role if we have a series of data and want a pictorial representation of that data. In other words if we have data and with a minimum and maximum value, then we can apply interval charts to those values with a series of data. Here the minimum and maximum values might be anything, it may be numbers, may be percentiles or many other thins.
So intervals are nothing, they are just a simple representation of data for specific periods. There are mainly six types of intervals available in Google Charts. Those intervals are given below and I describe them one by one for you.
- Line Interval
- Bar Interval
- Box Interval
- Stick Interval
- Point Interval
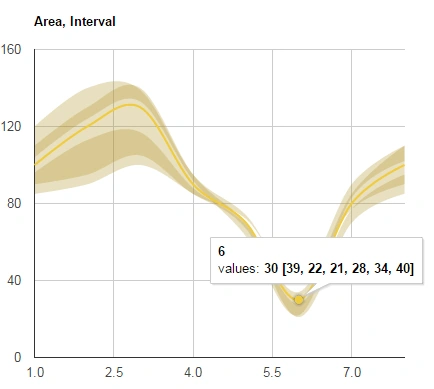
- Area Interval
- Combination of intervals
Line Interval
In line intervals we represent some points on the line and when we click on the line then there is a tool tip that occurs that shows the data depending on our needs or our representation. In the line Intervals we have a series of intervals on a line and when we go to these intervals then a pop-up occurs and that shows the data.
Example of Line Interval
- <htmL>
- <head>
- <script type="text/javascript" src="https://www.google.com/jsapi"></script>
- <script type="text/javascript">
- google.load("visualization", "1", {packages:["corechart"]});
- google.setOnLoadCallback(drawChart);
- function drawChart() {
- var data = new google.visualization.DataTable();
- data.addColumn('number', 'x');
- data.addColumn('number', 'values');
- data.addColumn({id:'i0', type:'number', role:'interval','color':'#D3362D'});
- data.addColumn({id:'i1', type:'number', role:'interval','color':'#D3362D'});
- data.addColumn({id:'i2', type:'number', role:'interval','color':'#D3362D'});
- data.addColumn({id:'i2', type:'number', role:'interval','color':'#D3362D'});
- data.addColumn({id:'i2', type:'number', role:'interval','color':'#D3362D'});
- data.addColumn({id:'i2', type:'number', role:'interval','color':'#D3362D'});
- data.addRows([
- [1, 200, 190, 110, 185, 196, 204, 220],
- [2, 120, 95, 130, 90, 113, 124, 140],
- [3, 80, 60, 80, 40, 77, 97, 93],
- [4, 90, 85, 95, 85, 88, 92, 95],
- [5, 70, 74, 63, 67, 69, 70, 72],
- [6, 330, 339, 322, 321, 328, 334, 340],
- [7, 80, 77, 83, 70, 77, 85, 90],
- [8, 280, 290, 310, 285, 295, 302, 310]]);
- var options_lines = {
- title: 'Line intervals, tailored',
- lineWidth: 4,
- curveType:'function',
- interval: {
- 'i0': { 'style':'line', 'color':'#D3362D', 'lineWidth': 0.5 },
- 'i1': { 'style':'line', 'color':'#F1CA3A', 'lineWidth': 1 },
- 'i2': { 'style':'line', 'color':'#5F9654', 'lineWidth': 2 },
- },
- legend: 'none',
- };
- var chart_lines = new google.visualization.LineChart(document.getElementById('chart_lines'));
- chart_lines.draw(data, options_lines);
- }
- </script>
- </head>
- <body>
- <div id="chart_lines" style="width: 600px; height: 500px;"></div>
- </body>
- </html>
Output
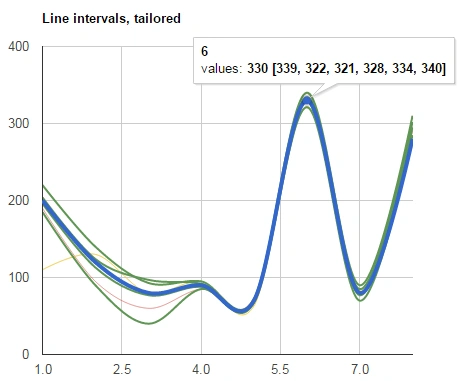
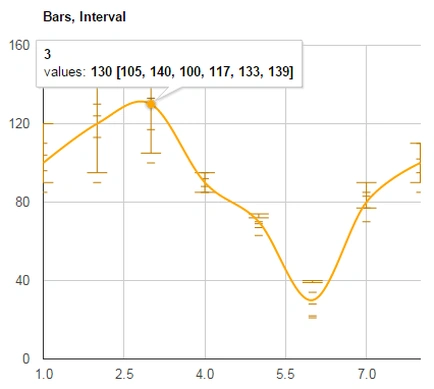
Bar Interval
Example of Bar Interval
- <html>
- <head>
- <script type="text/javascript" src="https://www.google.com/jsapi"></script>
- <script type="text/javascript">
- google.load("visualization", "1", {packages:["corechart"]});
- google.setOnLoadCallback(drawChart);
- function drawChart() {
- var data = new google.visualization.DataTable();
- data.addColumn('number', 'x');
- data.addColumn('number', 'values');
- data.addColumn({id:'i0', type:'number', role:'interval'});
- data.addColumn({id:'i1', type:'number', role:'interval'});
- data.addColumn({id:'i2', type:'number', role:'interval'});
- data.addColumn({id:'i2', type:'number', role:'interval'});
- data.addColumn({id:'i2', type:'number', role:'interval'});
- data.addColumn({id:'i2', type:'number', role:'interval'});
- data.addRows([
- [1, 100, 90, 110, 85, 96, 104, 120],
- [2, 120, 95, 130, 90, 113, 124, 140],
- [3, 130, 105, 140, 100, 117, 133, 139],
- [4, 90, 85, 95, 85, 88, 92, 95],
- [5, 70, 74, 63, 67, 69, 70, 72],
- [6, 30, 39, 22, 21, 28, 34, 40],
- [7, 80, 77, 83, 70, 77, 85, 90],
- [8, 100, 90, 110, 85, 95, 102, 110]]);
- var options_bars = {
- title: 'Bars, Interval',
- curveType: 'function',
- series: [{'color': 'Orange'}],
- intervals: { style: 'bars' },
- legend: 'none',
- };
- var chart_lines = new google.visualization.LineChart(document.getElementById('chart_lines'));
- chart_lines.draw(data, options_bars);
- }
- </script>
- </head>
- <body>
- <div id="chart_lines" style="width: 600px; height: 500px;"></div>
- </body>
- </html>
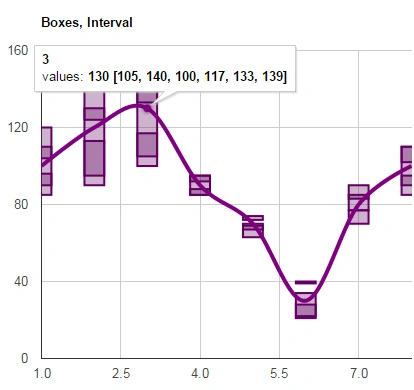
Box interval
Example of Box interval
- <html>
- <head>
- <script type="text/javascript" src="https://www.google.com/jsapi"></script>
- <script type="text/javascript">
- google.load("visualization", "1", {packages:["corechart"]});
- google.setOnLoadCallback(drawChart);
- function drawChart() {
- var data = new google.visualization.DataTable();
- data.addColumn('number', 'x');
- data.addColumn('number', 'values');
- data.addColumn({id:'i0', type:'number', role:'interval'});
- data.addColumn({id:'i1', type:'number', role:'interval'});
- data.addColumn({id:'i2', type:'number', role:'interval'});
- data.addColumn({id:'i2', type:'number', role:'interval'});
- data.addColumn({id:'i2', type:'number', role:'interval'});
- data.addColumn({id:'i2', type:'number', role:'interval'});
- data.addRows([
- [1, 100, 90, 110, 85, 96, 104, 120],
- [2, 120, 95, 130, 90, 113, 124, 140],
- [3, 130, 105, 140, 100, 117, 133, 139],
- [4, 90, 85, 95, 85, 88, 92, 95],
- [5, 70, 74, 63, 67, 69, 70, 72],
- [6, 30, 39, 22, 21, 28, 34, 40],
- [7, 80, 77, 83, 70, 77, 85, 90],
- [8, 100, 90, 110, 85, 95, 102, 110]]);
- var options = {
- title:'Boxes, Interval',
- curveType:'function',
- lineWidth: 4,
- series: [{'color': 'purple'}],
- intervals: { 'lineWidth':2, 'barWidth': 0.5, style: 'boxes' },
- legend: 'none',
- };
- var chart_lines = new google.visualization.LineChart(document.getElementById('chart_lines'));
- chart_lines.draw(data, options);
- }
- </script>
- </head>
- <body>
- <div id="chart_lines" style="width: 600px; height: 500px;"></div>
- </body>
- </html>
Output
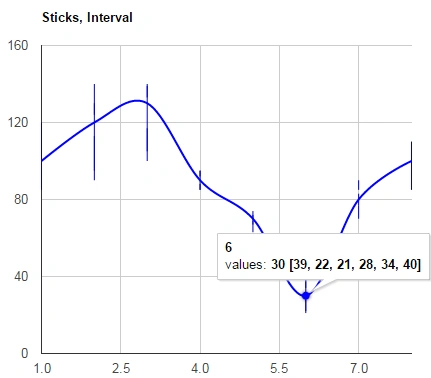
Stick Interval
Example of stick interval
- <html>
- <head>
- <script type="text/javascript" src="https://www.google.com/jsapi"></script>
- <script type="text/javascript">
- google.load("visualization", "1", {packages:["corechart"]});
- google.setOnLoadCallback(drawChart);
- function drawChart() {
- var data = new google.visualization.DataTable();
- data.addColumn('number', 'x');
- data.addColumn('number', 'values');
- data.addColumn({id:'i0', type:'number', role:'interval'});
- data.addColumn({id:'i1', type:'number', role:'interval'});
- data.addColumn({id:'i2', type:'number', role:'interval'});
- data.addColumn({id:'i2', type:'number', role:'interval'});
- data.addColumn({id:'i2', type:'number', role:'interval'});
- data.addColumn({id:'i2', type:'number', role:'interval'});
- data.addRows([
- [1, 100, 90, 110, 85, 96, 104, 120],
- [2, 120, 95, 130, 90, 113, 124, 140],
- [3, 130, 105, 140, 100, 117, 133, 139],
- [4, 90, 85, 95, 85, 88, 92, 95],
- [5, 70, 74, 63, 67, 69, 70, 72],
- [6, 30, 39, 22, 21, 28, 34, 40],
- [7, 80, 77, 83, 70, 77, 85, 90],
- [8, 100, 90, 110, 85, 95, 102, 110]]);
- var options_sticks = {
- title:'Sticks, Interval',
- curveType:'function',
- series: [{'color': 'Blue'}],
- intervals: { style: 'sticks' },
- legend: 'none',
- };
- var chart_lines = new google.visualization.LineChart(document.getElementById('chart_lines'));
- chart_lines.draw(data, options_sticks);
- }
- </script>
- </head>
- <body>
- <div id="chart_lines" style="width: 600px; height: 500px;"></div>
- </body>
- </html>
Output
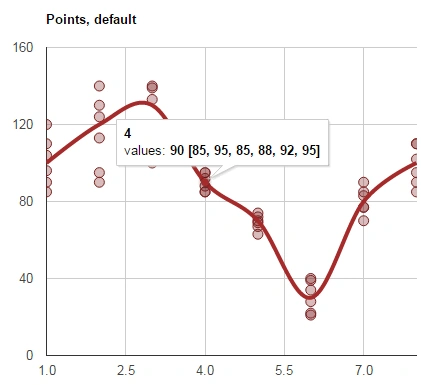
Point interval
Example of points interval
- <html>
- <head>
- <script type="text/javascript" src="https://www.google.com/jsapi"></script>
- <script type="text/javascript">
- google.load("visualization", "1", {packages:["corechart"]});
- google.setOnLoadCallback(drawChart);
- function drawChart() {
- var data = new google.visualization.DataTable();
- data.addColumn('number', 'x');
- data.addColumn('number', 'values');
- data.addColumn({id:'i0', type:'number', role:'interval'});
- data.addColumn({id:'i1', type:'number', role:'interval'});
- data.addColumn({id:'i2', type:'number', role:'interval'});
- data.addColumn({id:'i2', type:'number', role:'interval'});
- data.addColumn({id:'i2', type:'number', role:'interval'});
- data.addColumn({id:'i2', type:'number', role:'interval'});
- data.addRows([
- [1, 100, 90, 110, 85, 96, 104, 120],
- [2, 120, 95, 130, 90, 113, 124, 140],
- [3, 130, 105, 140, 100, 117, 133, 139],
- [4, 90, 85, 95, 85, 88, 92, 95],
- [5, 70, 74, 63, 67, 69, 70, 72],
- [6, 30, 39, 22, 21, 28, 34, 40],
- [7, 80, 77, 83, 70, 77, 85, 90],
- [8, 100, 90, 110, 85, 95, 102, 110]]);
- var options_points = {
- title:'Points, default',
- curveType:'function',
- lineWidth: 4,
- series: [{'color': 'brown'}],
- intervals: { 'style':'points', pointSize: 10 },
- legend: 'none',
- };
- var chart_lines = new google.visualization.LineChart(document.getElementById('chart_lines'));
- chart_lines.draw(data, options_points);
- }
- </script>
- </head>
- <body>
- <div id="chart_lines" style="width: 600px; height: 500px;"></div>
- </body>
- </html>
Output
Area Interval
Example of Area Interval
- <html>
- <head>
- <script type="text/javascript" src="https://www.google.com/jsapi"></script>
- <script type="text/javascript">
- google.load("visualization", "1", {packages:["corechart"]});
- google.setOnLoadCallback(drawChart);
- function drawChart() {
- var data = new google.visualization.DataTable();
- data.addColumn('number', 'x');
- data.addColumn('number', 'values');
- data.addColumn({id:'i0', type:'number', role:'interval'});
- data.addColumn({id:'i1', type:'number', role:'interval'});
- data.addColumn({id:'i2', type:'number', role:'interval'});
- data.addColumn({id:'i2', type:'number', role:'interval'});
- data.addColumn({id:'i2', type:'number', role:'interval'});
- data.addColumn({id:'i2', type:'number', role:'interval'});
- data.addRows([
- [1, 100, 90, 110, 85, 96, 104, 120],
- [2, 120, 95, 130, 90, 113, 124, 140],
- [3, 130, 105, 140, 100, 117, 133, 139],
- [4, 90, 85, 95, 85, 88, 92, 95],
- [5, 70, 74, 63, 67, 69, 70, 72],
- [6, 30, 39, 22, 21, 28, 34, 40],
- [7, 80, 77, 83, 70, 77, 85, 90],
- [8, 100, 90, 110, 85, 95, 102, 110]]);
- var options = {
- title:'Area, Interval',
- curveType:'function',
- series: [{'color': '#F1CA3A'}],
- intervals: { 'style':'area' },
- legend: 'none',
- };
- var chart_lines = new google.visualization.LineChart(document.getElementById('chart_lines'));
- chart_lines.draw(data, options);
- }
- </script>
- </head>
- <body>
- <div id="chart_lines" style="width: 600px; height: 500px;"></div>
- </body>
- </html>
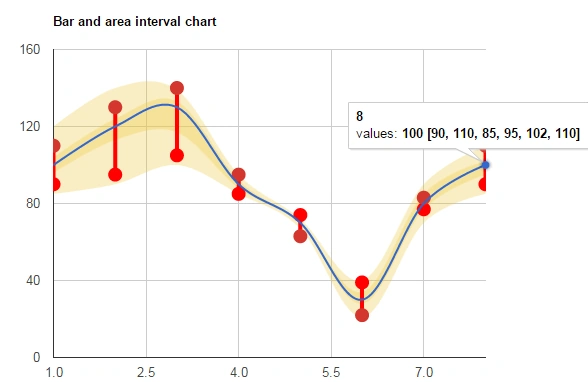
Combination of Area and bars intervals
Example of bar with Area intervals
- <html>
- <head>
- <script type="text/javascript" src="https://www.google.com/jsapi"></script>
- <script type="text/javascript">
- google.load("visualization", "1", {packages:["corechart"]});
- google.setOnLoadCallback(drawChart);
- function drawChart() {
- var data = new google.visualization.DataTable();
- data.addColumn('number', 'x');
- data.addColumn('number', 'values');
- data.addColumn({id:'i0', type:'number', role:'interval'});
- data.addColumn({id:'i1', type:'number', role:'interval'});
- data.addColumn({id:'i2', type:'number', role:'interval'});
- data.addColumn({id:'i2', type:'number', role:'interval'});
- data.addColumn({id:'i2', type:'number', role:'interval'});
- data.addColumn({id:'i2', type:'number', role:'interval'});
- data.addRows([
- [1, 100, 90, 110, 85, 96, 104, 120],
- [2, 120, 95, 130, 90, 113, 124, 140],
- [3, 130, 105, 140, 100, 117, 133, 139],
- [4, 90, 85, 95, 85, 88, 92, 95],
- [5, 70, 74, 63, 67, 69, 70, 72],
- [6, 30, 39, 22, 21, 28, 34, 40],
- [7, 80, 77, 83, 70, 77, 85, 90],
- [8, 100, 90, 110, 85, 95, 102, 110]]);
- var options = {
- title:'Bar and area interval chart',
- curveType:'function',
- intervals: { 'color':'series-color' },
- interval: {
- 'i0': { 'color': 'red', 'style':'bars', 'barWidth':0, 'lineWidth':4, 'pointSize':10, 'fillOpacity':1 },
- 'i1': { 'color': '#D3362D', 'style':'bars', 'barWidth':0, 'lineWidth':4, 'pointSize':10, 'fillOpacity':1 },
- 'i2': { 'style':'area','color': '#F1CA3A', 'curveType':'function', 'fillOpacity':0.3 }},
- legend: 'none',
- };
- var chart_lines = new google.visualization.LineChart(document.getElementById('chart_lines'));
- chart_lines.draw(data, options);
- }
- </script>
- </head>
- <body>
- <div id="chart_lines" style="width: 700px; height: 500px;"></div>
- </body>
- </html>
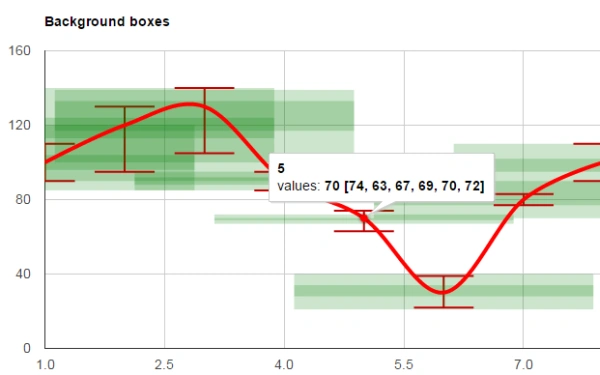
Combination of line interval with box interval
Example of line interval with box interval
- <html>
- <head>
- <script type="text/javascript" src="https://www.google.com/jsapi"></script>
- <script type="text/javascript">
- google.load("visualization", "1", {packages:["corechart"]});
- google.setOnLoadCallback(drawChart);
- function drawChart() {
- var data = new google.visualization.DataTable();
- data.addColumn('number', 'x');
- data.addColumn('number', 'values');
- data.addColumn({id:'i0', type:'number', role:'interval'});
- data.addColumn({id:'i1', type:'number', role:'interval'});
- data.addColumn({id:'i2', type:'number', role:'interval'});
- data.addColumn({id:'i2', type:'number', role:'interval'});
- data.addColumn({id:'i2', type:'number', role:'interval'});
- data.addColumn({id:'i2', type:'number', role:'interval'});
- data.addRows([
- [1, 100, 90, 110, 85, 96, 104, 120],
- [2, 120, 95, 130, 90, 113, 124, 140],
- [3, 130, 105, 140, 100, 117, 133, 139],
- [4, 90, 85, 95, 85, 88, 92, 95],
- [5, 70, 74, 63, 67, 69, 70, 72],
- [6, 30, 39, 22, 21, 28, 34, 40],
- [7, 80, 77, 83, 70, 77, 85, 90],
- [8, 100, 90, 110, 85, 95, 102, 110]]);
- var options_boxes_background = {
- title:'Background boxes',
- curveType:'function',
- lineWidth: 4,
- series: [{'color': 'Red'}],
- intervals: { 'lineWidth':2, 'barWidth': 0.5 },
- interval: {
- 'i2': { 'style':'boxes', 'color':'Green', 'boxWidth': 2.5,
- 'lineWidth': 0, 'fillOpacity': 0.2 }
- },
- legend: 'none',
- };
- var chart_lines = new google.visualization.LineChart(document.getElementById('chart_lines'));
- chart_lines.draw(data, options_boxes_background);
- }
- </script>
- </head>
- <body>
- <div id="chart_lines" style="width: 900px; height: 500px;"></div>
- </body>
- </html>
Output
Summary
Intervals make intervals in the data, we create some intervals between the first point to the end point and represent the data on that specific intervals so we can say that intervals are used to show the data in the chart at a specific position. It is dependent on you which intervals you prefer to use because there are six main intervals given by the Google Chart control.
When we click on the intervals it shows the data in the pop-up forms so it looks very interesting when you play with it. I hope this article will be useful for everyone that wants to become familiar with intervals in charts.
M MrPosted Jul 10, 2018, 8:17 AM
Thanks Rizwan, this is very helpful. Is it possible to display the values on point/sticks on Bar interval chart by default? Instead of showing the values when you hover over, can we show them on points all the time? thanks.