

When I work with DAX and Power Query, I find that some of the most useful functions are also the simplest ones, and ABS is a good example of that. It doesn't do anything complicated: it takes a number and returns its absolute value, meaning the number stripped of its sign. A negative value becomes positive, and a positive value stays unchanged.
The syntax is straightforward: ABS(<number>)
The argument can be a literal number, a column reference, or the result of another expression. DAX evaluates whatever you pass in and returns the magnitude of that value.
Absolute Variance = ABS([Actual] - [Budget])
At first glance, this might seem too basic to matter much in a data model, but it turns out to be one of the more practical tools available once you're working with any dataset that mixes positive and negative values which is more common than it might seem. Financial transactions, variance reports, inventory adjustments, and returns data all tend to include both debits and credits, gains and losses, additions and subtractions. In many of these cases, what you actually want to measure is the size of the change, not its direction.
Common Use Cases
Variance analysis. When comparing actuals to budget, or forecasts to results, the direction of the variance (over or under) is often less important than its magnitude when you're trying to rank or flag the largest discrepancies. ABS lets you sort or filter by size without the sign getting in the way.
Threshold and tolerance checks. Instead of writing two separate conditions to catch values that are "too high" or "too low," ABS lets you express both in a single comparison.
Out of Tolerance = IF(ABS([Actual] - [Target]) > 100, "Flag", "OK")
Normalizing inconsistent data. Some source systems record certain transactions as negative and others as positive depending on how they were entered. ABS can standardize these for reporting purposes, though it's worth investigating the root cause rather than treating it as a permanent fix.
Distance-based calculations. Any time you need to measure how far a value sits from a reference point, such as an average or midpoint, in either direction, ABS is the natural function to use.
An Important Caveat
ABS removes information. Once a value has been passed through it, you can no longer tell from that number alone whether the original was positive or negative. This matters because a variance of $500 could mean a department overspent or underspent, and those are very different situations even though the absolute values are the same.
A pattern I rely on is to keep the signed value as the source of truth, and create a second measure purely for sorting, ranking, or visual thresholds.
Variance = [Actual] - [Budget]
Abs Variance (sorting) = ABS([Variance])
Variance Direction = IF([Variance] >= 0, "Over", "Under")
This way, the report can sort by magnitude while still communicating direction separately, whether through a label, an icon, or color formatting.
With that foundation in place, here's how to put ABS to work using in Power BI
1
Import data into Power BIOpen Power BI Desktop, go to Home > Get Data > Text/CSV, and select orders_sample.csv. Power BI will show a preview of the OrderID, OrderDate, Product, and Amount columns. Click Load, or Transform Data first if you want to check data types before loading.
2
Check the Amount column's data typeIn Power Query Editor (or under the Data view after loading), confirm the Amount column is typed as Decimal Number or Fixed Decimal Number, not Text. If it loaded as text, select the column, go to the Column Tools ribbon, and change the data type — ABS() requires a numeric input.
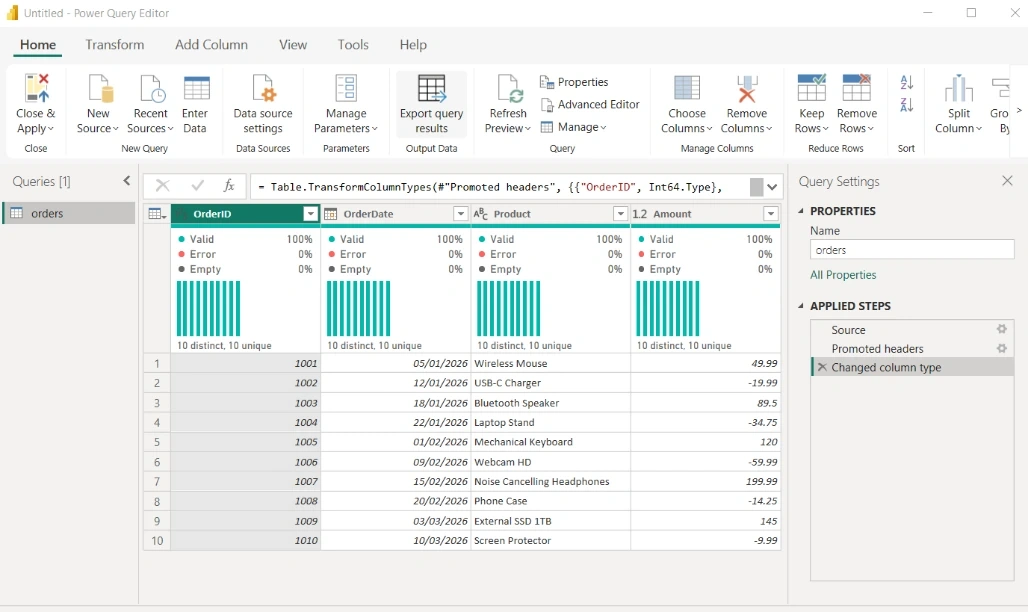
3
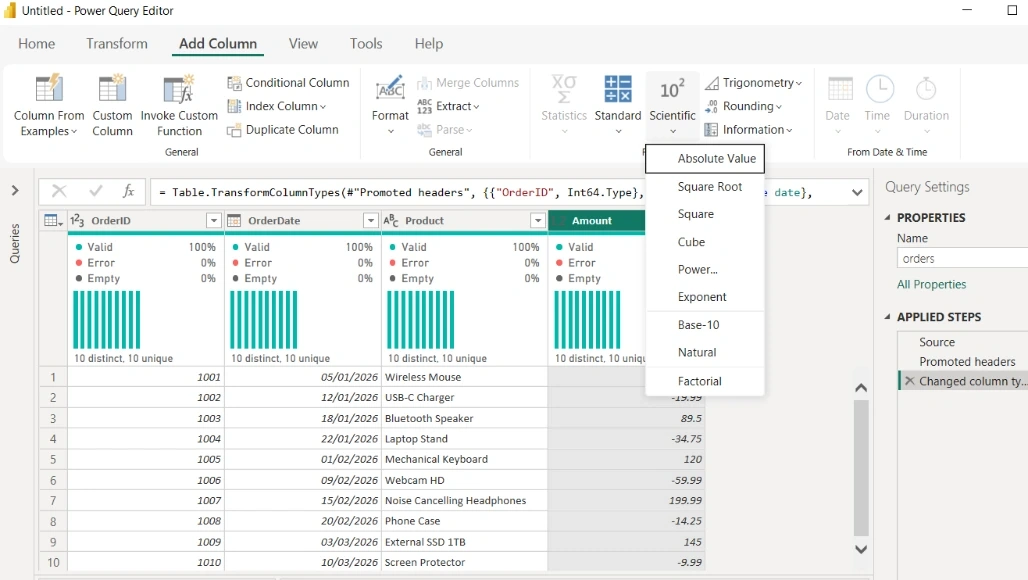
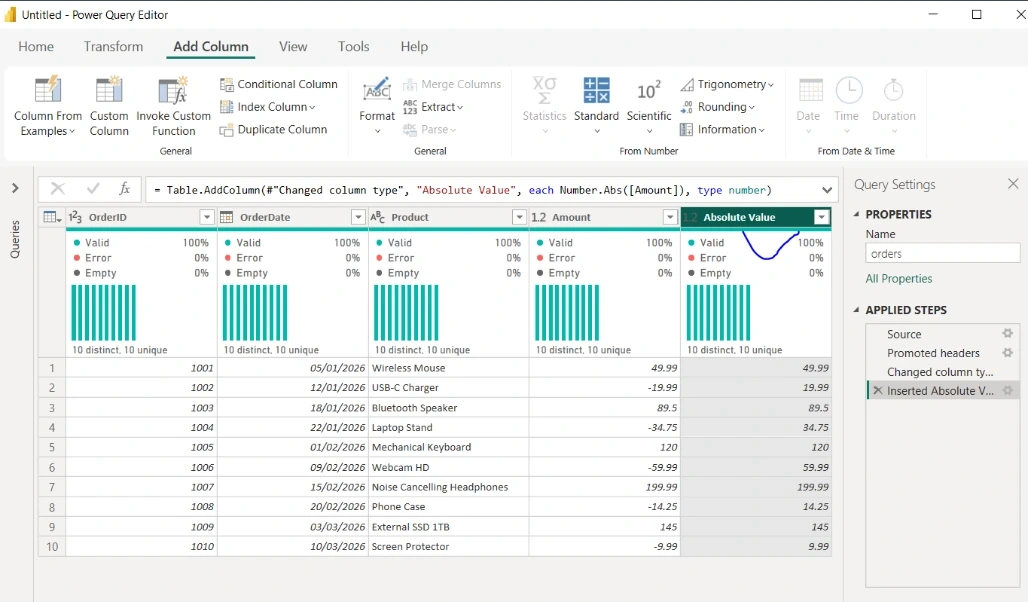
Create an Absolute Amount column in Power QuerySimilar to Power BI DAX that we will look at in the next step, Power Query allows you to use the graphical user interface to create Absolute Amount column where all the Amount with negative numbers will be converted to positive numbers. To do that from Power Query,
Select the Amount column
In the Scientific dropdown of the Add column tab, select Absolute value
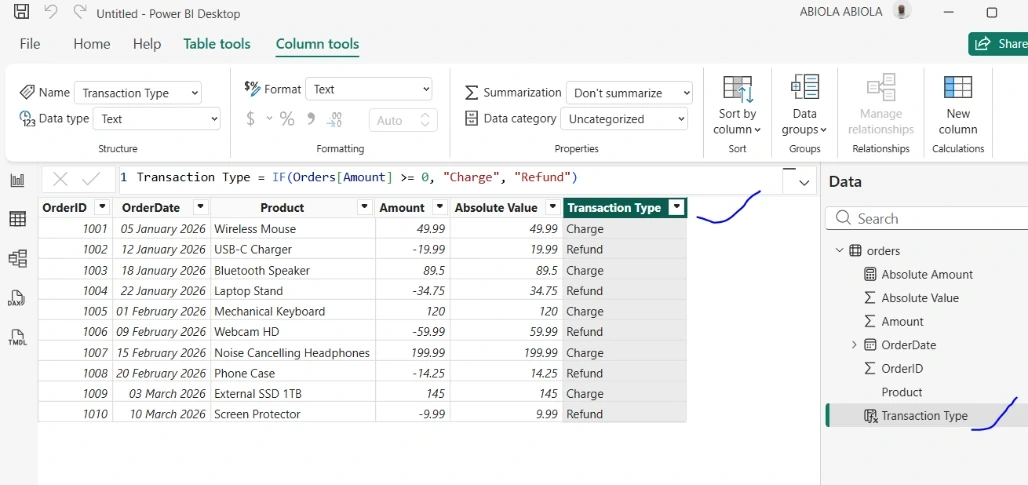
As seen below we have a new column named as Absolute Value and all the numbers are now returned as positive number
4
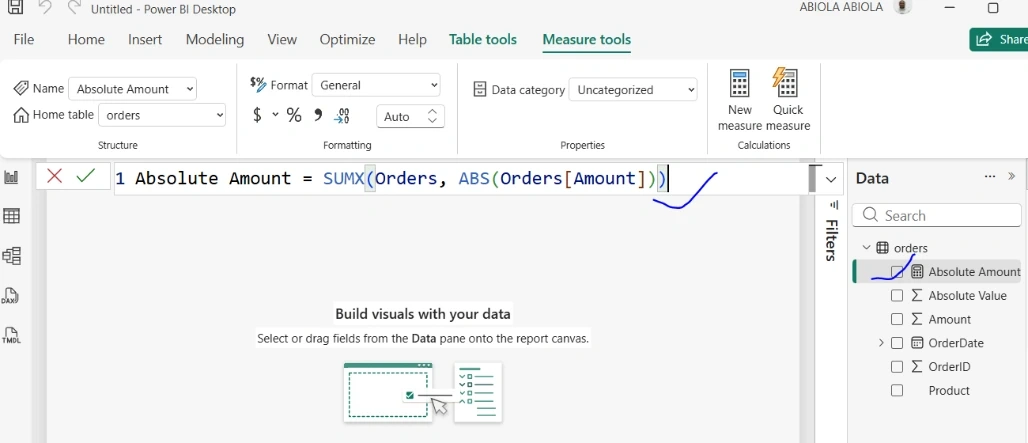
Create an Absolute Amount measureTo create an Absolute Amount using DAX measure, go to Modeling > New Measure and enter: Absolute Amount = SUMX(Orders, ABS(Orders[Amount])). This sums the absolute value of every row's Amount, so refunds or negative entries no longer offset positive ones in the total and it is useful when you want total transaction volume rather than net movement.
5
Add a Transaction Type column for directionSince Absolute Amount alone hides direction, add a calculated column: Transaction Type = IF(Orders[Amount] >= 0, "Charge", "Refund"). This preserves the sign information as a readable label you can use for grouping or filtering.
6
Build a visual using both measuresCreate a table or bar chart with Product on rows, Transaction Type as a legend or filter, and Absolute Amount as value. Sort by Absolute Amount descending to surface the largest transactions regardless of whether they were charges or refunds.
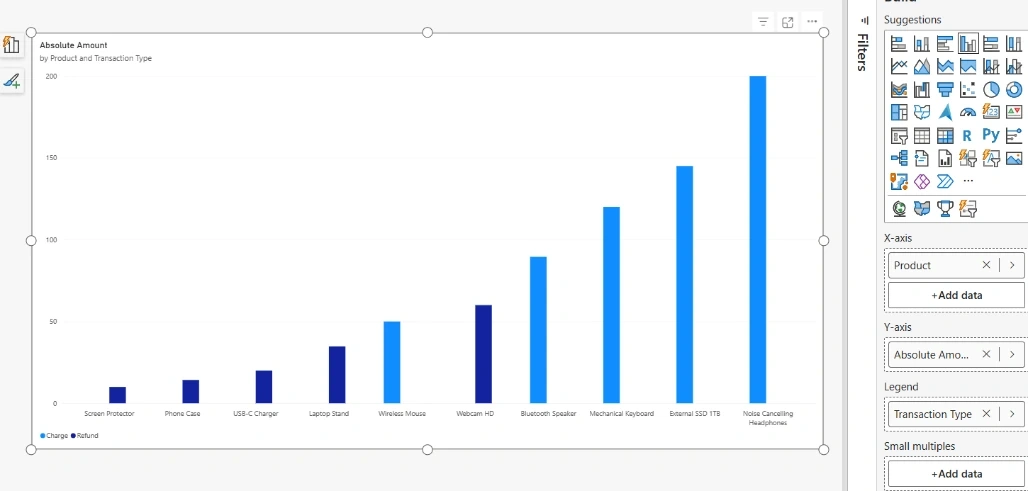
In this dataset, that Absolute Amount measure would total to $743.45 across all 10 orders.
Join the conversation! Your thoughts help the community grow.