

Building a website is not just about putting a pretty layout with working functionality. Scalability, reliability, and speed are the three key characteristics of good websites. Website developers should keep these characteristics in mind while building their websites.
Fortunately, there are several free and paid tools available that can help us test the load, speed, and the performance of a website. In this series of articles, we will take a look at some of the top tools. I start with Apache JMeter.
Apache JMeter
One day, someone asks you to do performance testing of www.yahoo.com for 150 users. What would you do?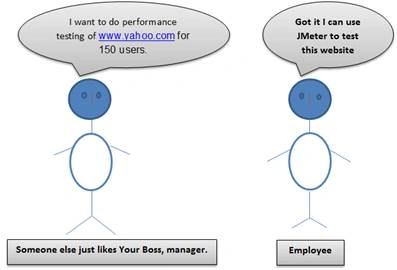
May be someone will ask you what JMeter is and why and how it works. This article will help you answer those questions.
What is JMeter?
Apache JMeter is an open source software, developed by Stefano Mazzocchi of the Apache Software Foundation, designed to test and measure its performance and functional behavior. Apache JMeter was first released in 1998 and the current version is 3.0 which was released on 17 May, 2016.
From website.
JMeter is basically used for testing Web application & FTP application. You can also use JMeter to analyze & measure the performance of web applications. Performance testing basically means that to test web application against heavy load and multiple/concurrent traffic. Now a days JMeter is used for database server test and functional test and so many more test.
Why JMeter?
You might be thinking why you should use JMeter for testing. The answer is, JMeter is a powerful tool with enormous testing capabilities.
Advantages
JMeter has some advantages, as described in the figure below: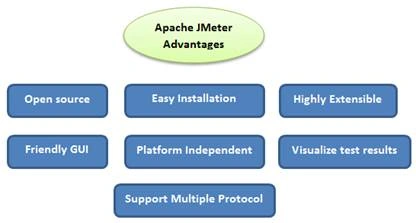
Now, let's describe them point to point.
- Open Source - Because, it’s free and allows the developers to use the source code for the development.
- Easy Installation - Copy and run the *.bat file to run the JMeter. No installation required.
- Highly Extensible - Write your own code and support visualization plugins to extend your testing.
- Friendly GUI - Easy to use and doesn’t take so much time to get familiar with it.
- Platform Independent- Because, this is a java desktop app and can run on multiple platforms.
- Visualize test results - Show the results in different formats, such as tree, table, and chart file etc.
- Support multiple protocols - It does not support web apps testing only but also supports the basic protocols, such as HTTP, JDBC, FTP, and JMS.
How JMeter Works?
The basic workflow of the JMeter can be seen in the image below: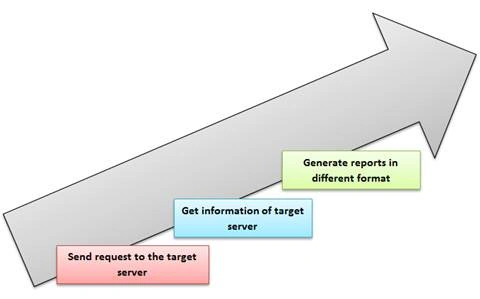
First, the user sends the request to the target server. Then, it gets the useful information of the target server and provides you with the results in different formats, such as Graphics, Chart, and Tree.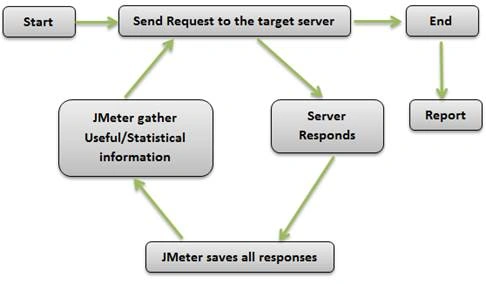
The demonstration of the JMeter testing tool:
Step 1: We can download the Apache JMeter testing tool form this site.
If you click this link, a new window will open. There, you can download the file, as highlighted in the following image. It’s a zip file.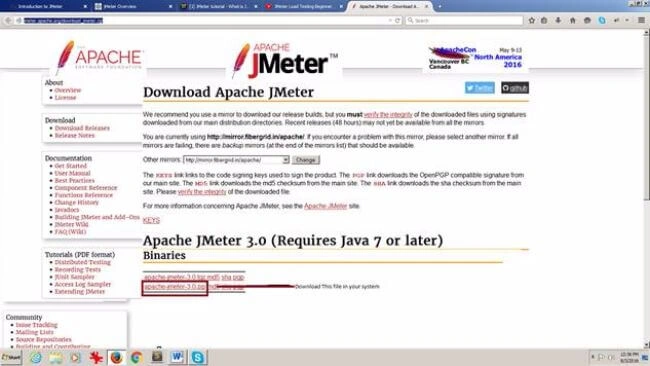
Step 2: Once the download is complete, extract the file in your system.
Step 3: Now, you can run this tool, but first, you need to check the version of Java. If you don’t have version 7 installed, the application will not work.
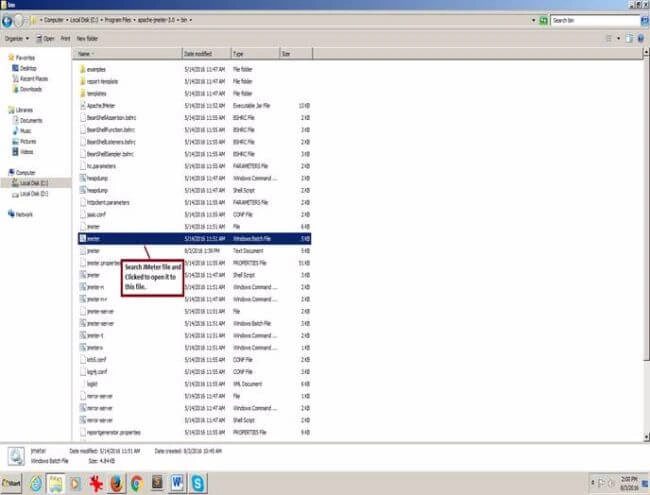
Step 4: Open the Bin folder and search for the JMeter file (It will be Windows batch file). Now, click open this file.
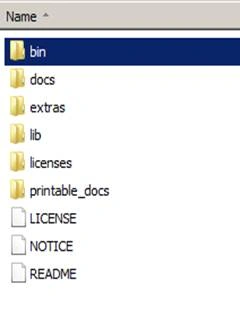
Step 5: When you start the JMeter, you will see two branches in the left pane, Test Plan and Workbench.
Test Plan is the place where your tests will go live. A complete test plan can contain one or more threads, groups, listeners, timers, and configuration elements.
Workbench, however, is the place where the tests are stored temporarily while they are run. JMeter throws away the content of workbench, upon exit. So, JMeter only saves the content of the Test Plan branch, not the Workbench.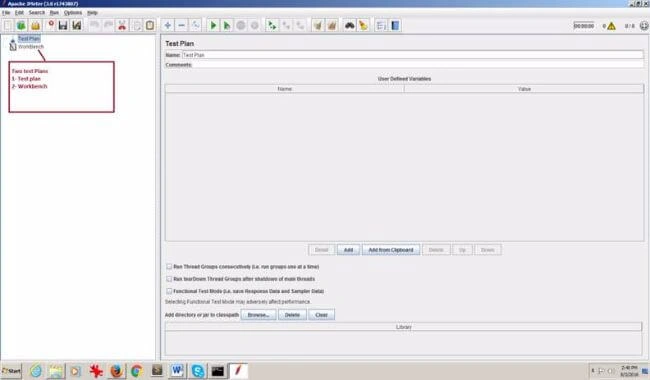
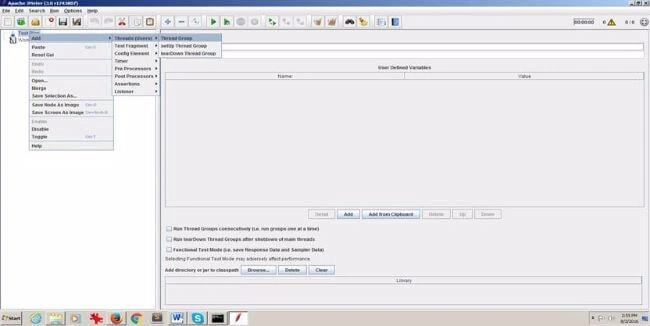
Step 6: Now, the next step is the configuration of the Tree elements. In Test Plan, any element can be configured using the control panel. Just right click on the Test Plan, go to Add >> Threads (Users) >> Thread Group.
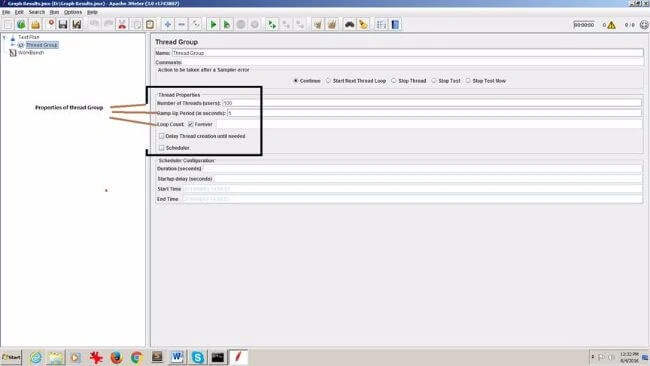
A Thread Group is the beginning point of your Test Plan that controls the number of threads used by JMeter during the test. Thread Group has some properties, as listed below:
- Number of Threads (users) simply means the numbers of users that can be added.
- Ramp up Period (in seconds) means how much time this tool (Apache JMeter) should take to get all the threads started.
- Loop Count means how many times the test case will be performed for each thread.
Step 7: Now, the next step is to work on Controllers. Basically, there are two types of controllers - Sampler & Logic. Here, we will discuss the Sampler only.
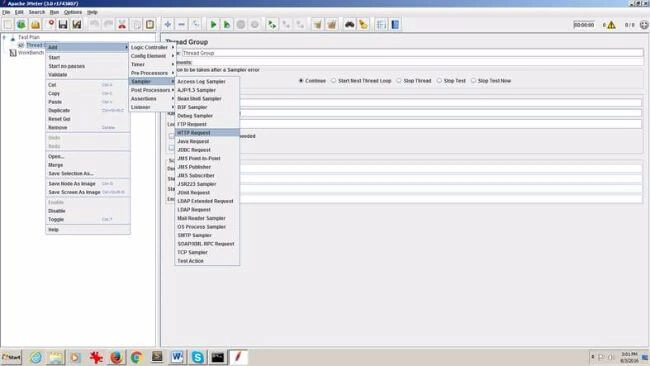
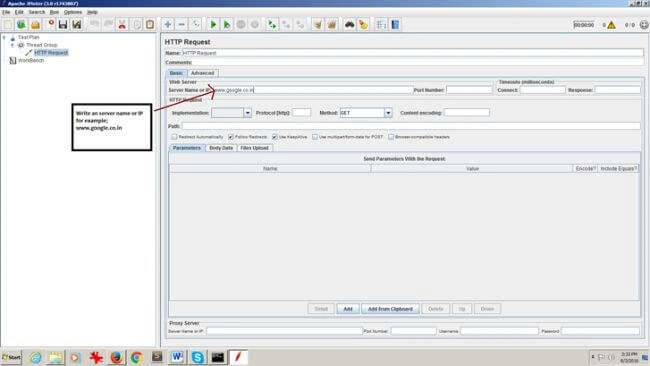
Just right click on the Thread Group and go to Add >> Sampler >> HTTP Request.
Sampler is nothing but the medium that allows the send requests on a server when a user requests for a page from the server. There are a lot of useful samplers, including HTTP & FTP Request, JAVA & JDBC Request and RPC Requests. We are using only HTTP Request.
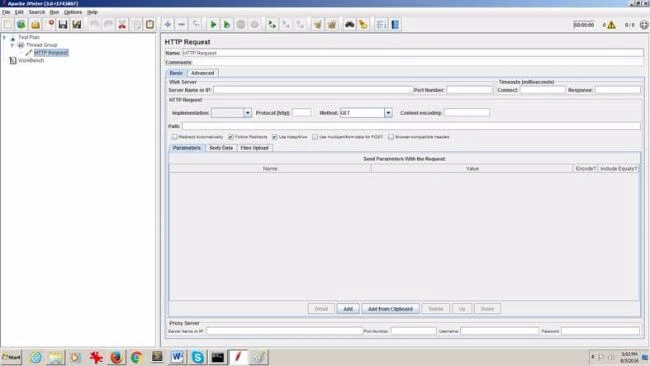
In HTTP request, you can write any Server name or IP address that you want to test. For example, www.facebook.com, or www.google.co.in, or even www.c-sharpcorner.com. Remember one thing. You don't have to write http in the URL of the Server.
Step 8: Now, the next step is to use the Listeners for viewing the results in the form of tree, graphs, and table, and also, for providing the visual access of the data gathered by JMeter.
Listener can be added anywhere in the test. JMeter provides a lots of Listeners, such as, View results in Table, Graph results, Monitor results etc. Just right click on the Thread Group and go to Add >> Listener >> View results in Table.
We are using View Results in Table and Graph Results, only.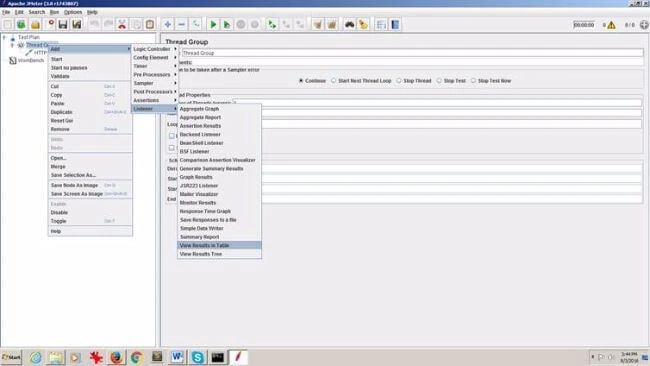
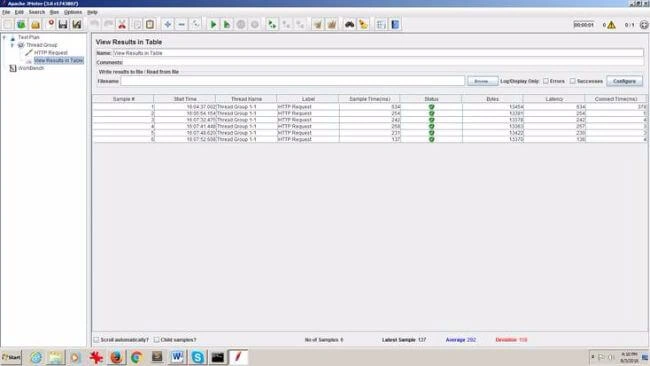
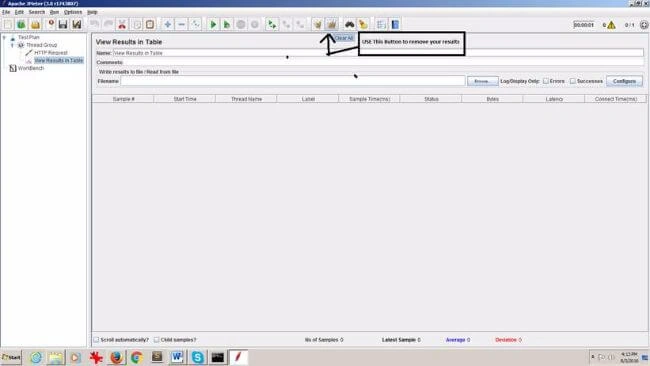
Now, you get the following screenshot A where you get the results in Table View after running your Test Plan. If you want to remove all the results from the table, just use the Clear All Button, as shown in screenshot B.
Now, let's discuss the Graph Results.
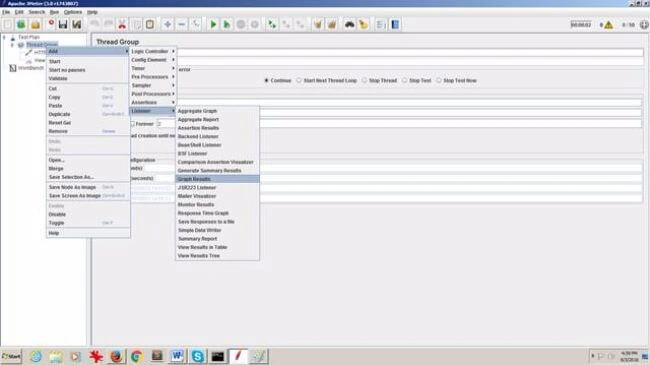
Now, you will see the results in graphical form.
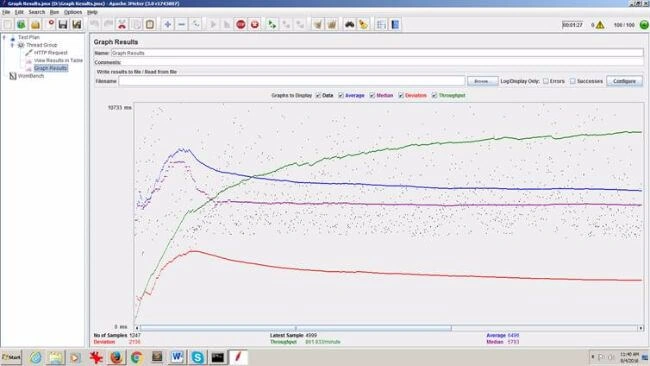
The graph of results is displayed in the form of Data, Average, Median, Deviation and Throughput. Let us discuss it point to point.
- DATA means the plotting of actual data values ( represented in the above image in Black).
- Average means average time of a set of results (in Blue).
- Median divides the samples into two equal halves.
- Deviation measures the variability of a data set (in Red).
- Throughput means the plotting of the samples per unit of time (in Green).
So, this is how we can test a website, using JMeter, in order to increase the performance, reliability, and the speed of it.
Hanif HefazPosted Aug 24, 2016, 9:26 AM
Nice share.
Kalyankumar RavichandranPosted Aug 20, 2016, 2:18 AM
A great article for beginners and JMeter also supports client side performance testing, we can use firefox/chrome browser plugin and easily test with them. If possible i will add an article on it soon.
Ibrahim ErsoyPosted Aug 12, 2016, 11:10 AM
I use YSlow.Very helpful.Works well on every web project.
Prasanna MuraliPosted Aug 12, 2016, 2:54 AM
Nice share
Vignesh ManiPosted Aug 11, 2016, 11:35 AM
Good one sir.
VenkatPosted Aug 11, 2016, 9:36 AM
Nice article tested a sample works fine.Thanks a lot
Bhuvanesh MohankumarPosted Aug 11, 2016, 4:33 AM
Helpful article