

In the previous articles we have seen a way of logging information and
publishing in Windows Azure. In this article we can experiment on Profiling.
Why we need Profiling?
Profiling is needed for performance measurement of an application. In the
runtime we can see the real load on hardware:
- CPU
- Memory
- Hard Disk etc.
For example, if the CPU load is 100% on 10 user
requests, then we are sure that the application needs to be load balance when
100 user requests are expected. Otherwise the application performance will be
reduced due to request processing delay.
In the case of an Azure application we can decide on adding more instances of the web role
or worker role based on performance information.
Pre-Requisites
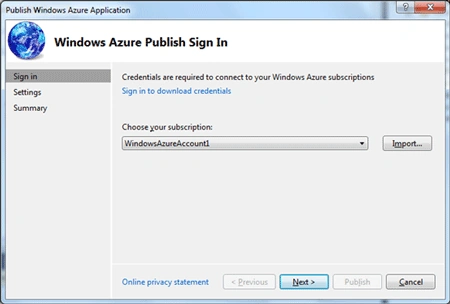
This article requires knowledge of publishing azure applications using Visual
Studio IDE. You can get the complete article
here.
Steps
Please follow the steps to experiment Profiling for Windows Azure applications.
Step 1: Create a Worker Role
Create a new worker role and modify the Run() method as following.
public
override
void
Run()
{
// This is a sample worker implementation. Replace with your
logic.
Trace.WriteLine("$projectname$
entry point called",
"Information");
while
(true)
{
List<string>
list =
new
List<string>();
Gowtham RajamanickamPosted May 18, 2015, 1:00 PM
informative..