

This article shows how to use Kendo UI Charts using WEB API 2 and Entity Framework 5.
First let us explain the basic usage of Kendo UI Charts.
The very basic usage of this Kendo UI Charts involves only the design and a script.
Here is my simple Kendo UI chart HTML design.
- <!DOCTYPE html>
- <html
- xmlns="http://www.w3.org/1999/xhtml">
- <head>
- <link href="Content/kendo/2014.2.716/kendo.common.min.css" rel="stylesheet" />
- <link href="Content/kendo/2014.2.716/kendo.default.min.css" rel="stylesheet" />
- <script src="Scripts/kendo/2014.2.716/jquery.min.js"></script>
- <script src="Scripts/kendo/2014.2.716/kendo.all.min.js"></script>
- <link href="https://maxcdn.bootstrapcdn.com/bootstrap/3.3.5/css/bootstrap.min.css" rel="stylesheet">
- <title> Kendo Chart</title>
- </head>
- <body>
- <h3 style="margin-left:50px;color:blueviolet"> Kendo Chart </h3>
- <br />
- <div id="Chart" style="width:1000px;height:300px"></div>
- </body>
- </html>
- function createChart() {
- $("#Chart").kendoChart({
- theme: "default",
- title: {
- Text: "Exam Score"
- },
- legned: {
- position: "bottom"
- },
- chartArea: {
- background: ""
- },
- seriesDefaults: {
- type: "column"
- },
- series: [{
- name: "Coimbatore College",
- data: [90, 88, 40, 80]
- }, {
- name: "World",
- data: [80, 88, 90, 30]
- }],
- valueAxis:
- {
- labels:
- {
- format: "{0}%"
- },
- plotBands: [{
- from: 100,
- to: 120,
- color: "gray"
- }]
- },
- categoryAxis: {
- categories: [
- new Date("2011/4/28"),
- new Date("2011/5/28"),
- new Date("2011/6/28"),
- new Date("2011/7/28"),
- ],
- baseUnit: "months"
- },
- tootip: {
- visibile: true,
- format: "{0}/100"
- }
- });
- }
- $(document).ready(function() {
- setTimeout(function() {
- createChart();
- }, 400)
- })
In the browser the view is as shown in Figure 1.
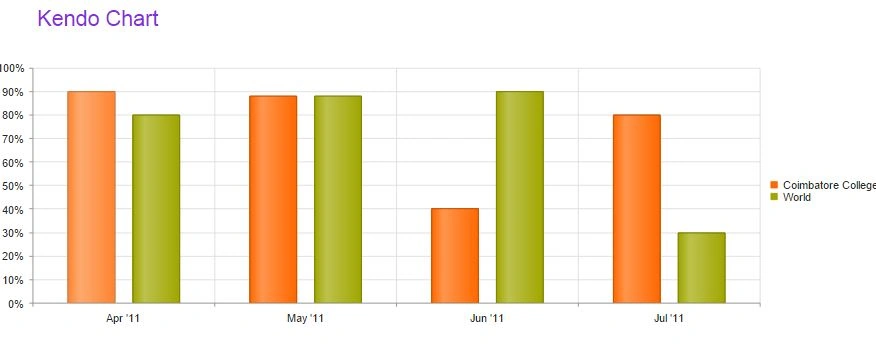
Figure 1
Now, let us explain remote binding in Kendo UI MVVM Chart.
Create a WEB API project as shown in Figure 2 & Figure 3.

Figure 2
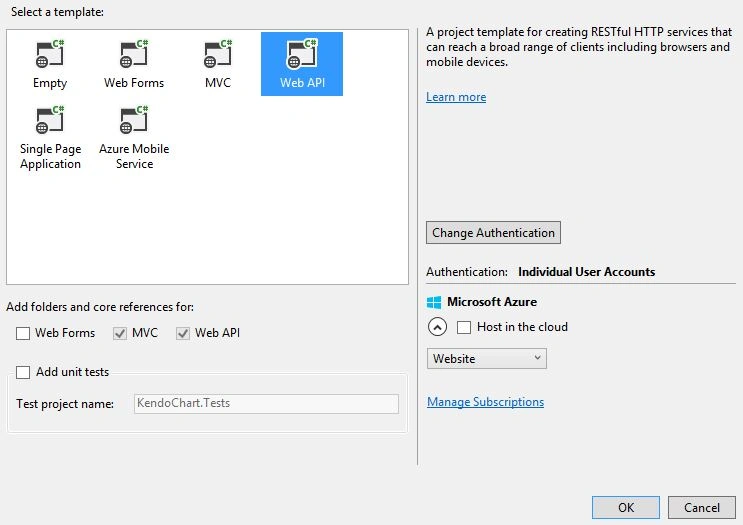
Figure 3
Your project structure will be as shown in Figure 4.

Figure 4
Create a new class under the Model folder and name it Expense.cs.
Write the following code in the Expense class.
- public class Expense
- {
- [Key]
- [DatabaseGenerated(DatabaseGeneratedOption.Identity)]
- public int ID {
- get;
- set;
- }
- [Required]
- public string Month {
- get;
- set;
- }
- [Required]
- public int MonthlyExpense {
- get;
- set;
- }
- }
So, create one more class under the Model folder and name it ExpenseContext.cs.
Write the following code in the ExpenseContext class.
- public class ExpenseContext:DbContext
- {
- public ExpenseContext() : base("name:TestConnection") { }
- public DbSet<Expense> MonthlyExpense { get; set; }
- }
- <connectionStrings>
- <add name="TestConnection" connectionString="Data Source=server name;Initial Catalog=Database Name;Integrated Security=True" providerN ame="System.Data.SqlClient" />
- </connectionStrings>
Add the controller class as shown in Figure 5 & Figure 6.

Figure 5

Figure 6
Now you will get HTTP GET, POST, PUT and DELETE predefined REST full services code in the ExpensesController class.
Now check that the HTTP POST service is using the POSTMAN tool as shown in Figure 7.

Figure 7
Yes, the service is working.
Now it's time to do the design.
Create a HTML page and write the following code.
- <!DOCTYPE html>
- <html
- xmlns="http://www.w3.org/1999/xhtml">
- <head>
- <title></title>
- <link rel="stylesheet" href="http://cdn.kendostatic.com/2015.1.408/styles/kendo.common.min.css">
- <link rel="stylesheet" href="http://cdn.kendostatic.com/2015.1.408/styles/kendo.rtl.min.css">
- <link rel="stylesheet" href="http://cdn.kendostatic.com/2015.1.408/styles/kendo.default.min.css">
- <link rel="stylesheet" href="http://cdn.kendostatic.com/2015.1.408/styles/kendo.dataviz.min.css">
- <link rel="stylesheet" href="http://cdn.kendostatic.com/2015.1.408/styles/kendo.dataviz.default.min.css">
- <link rel="stylesheet" href="http://cdn.kendostatic.com/2015.1.408/styles/kendo.mobile.all.min.css">
- <script src="http://code.jquery.com/jquery-1.9.1.min.js"></script>
- <script src="http://cdn.kendostatic.com/2015.1.408/js/kendo.all.min.js"></script>
- </head>
- <body>
- <div id="example">
- <div class="demo-section k-content">
- <div>
- <h4>Kendo Chart</h4>
- <div data-role="chart"
- data-legend="{position: 'bottom'}"
- data-series-defaults="{ type: 'column' }"
- data-series="[
- { field: 'MonthlyExpense', name: 'MonthlyExpense' },
- ]"
- data-bind="visible: isVisible,
- events: { seriesHover: onSeriesHover },
- source: Expense"
- style="height: 250px;"></div>
- </div>
- <div>
- <label id="lbl_msg"></label>
- </div>
- </div>
- </div>
- </body>
- </html>
- < script >
- function createChart() {
- var viewModel = kendo.observable({
- isVisible: true,
- onSeriesHover: function(e) {
- lbl_msg.textContent = e.series.name + e.value;
- },
- Expense: new kendo.data.DataSource({
- transport: {
- read: {
- url: "http://localhost:54249/api/Expenses/",
- dataType: "json"
- }
- },
- sort: {
- field: "ID",
- dir: "asc"
- }
- })
- });
- kendo.bind($("#example"), viewModel);
- }
- $(document).ready(createChart).bind("kendo:skinChange", createChart);
- < /script>

Figure 8
That's it, enjoy coding.
Arul RPosted Oct 28, 2015, 5:57 AM
Nice share!!!
Chervine BhiwooPosted Jul 11, 2015, 11:53 PM
Nice Article.
Sibeesh VenuPosted Jul 11, 2015, 8:21 AM
Nice share.
Debasis SahaPosted Jul 11, 2015, 3:53 AM
Good One..
Santhakumar MunuswamyPosted Jul 11, 2015, 2:55 AM
Nice article! Thanks for sharing
Nilesh JadavPosted Jul 11, 2015, 1:17 AM
Nice article sir