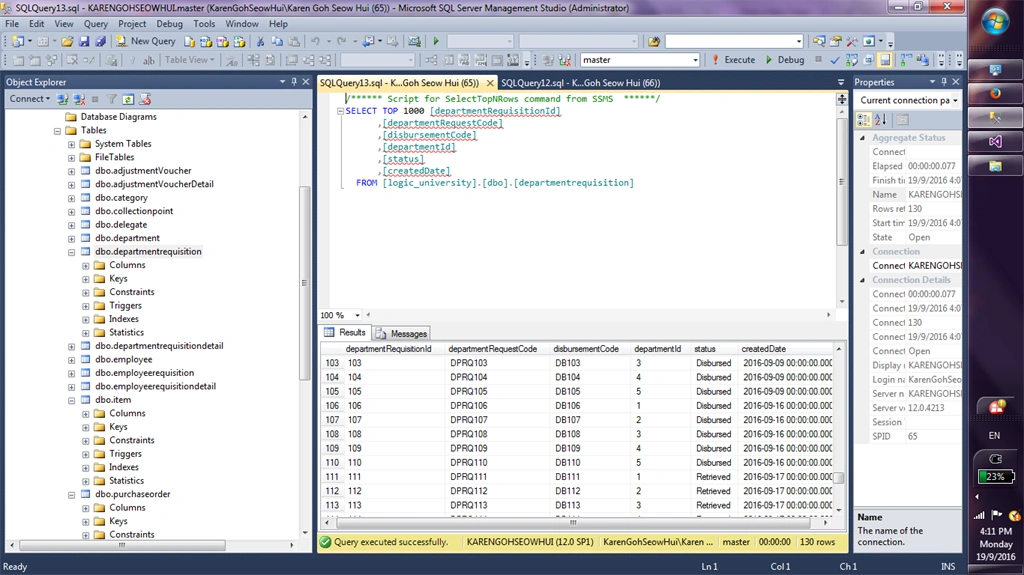
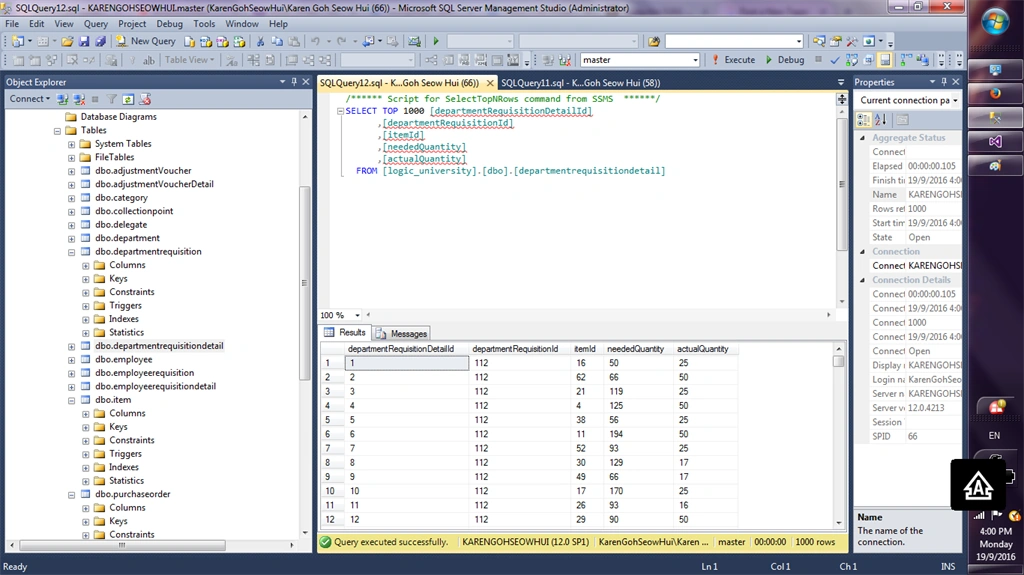
I have the above table namely departmentRequisition and departmentRequisitionDetail respectively.
From the departmentRequisitionDetail, there is a column - departmentRequisitionId - 112 and many rows of acutalQuanity that I need to add up as a total quantity to display as a pie chart.
Now, in order to know the department that ties to this total qauntity, I need to refer to another table - departmentRequisition which shows the deparmentId - 2 which ties to this departmentRequisitionId.
Can someone advise how should I write the query so that I can generate the pie chart ?
The above is just for one departmentId and I need to have different departmentId showing the acutalquanity which is the quantity they ordered.
Or is there a better way to generate my crystal report based on the scenario above ? Like create another table to make things easier.
Nitin SontakkePosted Sep 20, 2016, 5:16 AM
Tangara GPosted Sep 20, 2016, 4:59 AM
from departmentRequisitiondetail dr inner join departmentRequisition drd on dr.departmentRequisitionId = drd.departmentRequisitionId
group by dr.departmentRequisitionId, drd.departmentId order BY departmentRequisitionId DESC
Nitin SontakkePosted Sep 20, 2016, 3:54 AM
Tangara GPosted Sep 20, 2016, 3:39 AM
Bikesh SrivastavaPosted Sep 20, 2016, 3:01 AM
Nitin SontakkePosted Sep 19, 2016, 11:21 PM
Nitin SontakkePosted Sep 19, 2016, 1:03 PM
Tangara GPosted Sep 19, 2016, 11:07 AM
departmentRequisition(PK, int, not null)
departmentRequestCode(nvarchar, not null)
disbursementCode(nvarchar, not null)
departmentId(int, not null)
status(nvarchar, not null)
createdDate(datetime, not null)
the columns for departmentrequisitiondetail are :
departmentRequisitionDetailId(PK, int, not null)
departmentRequisitionId(FK, int, not null)
itemId(FK, int, not null)
neededQuantity(int, not null)
actualQuantity(int, not null)
Nitin SontakkePosted Sep 19, 2016, 5:19 AM