
I am working with line charts in RDLC with WPF, as I am new to charts, I stuck in breaking the charts into 2 or more parts
Have a look to the below graph
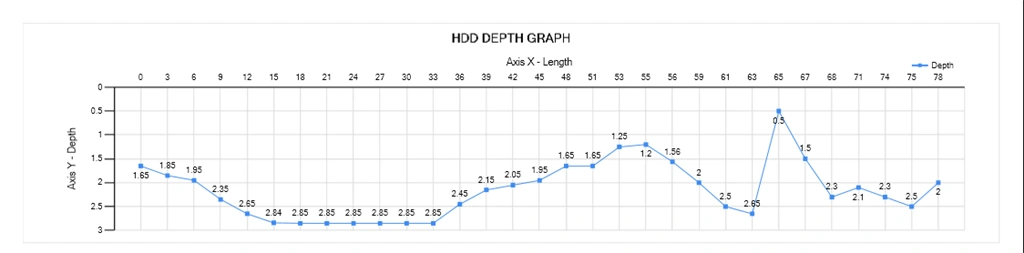
If X Axis having more data at a Maximum of 200, when I fill the data and depict it on the graph, it seems clumpsy, so I want to break it into 2 parts (100 each)
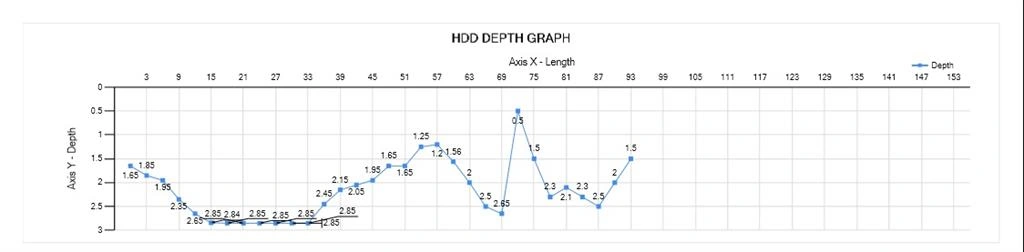
How do I break the chart into 2 or more parts.
Replies
Know the answer? Post it — somebody with the same question will find it here.