

Introduction
With the Power BI Designer we can connect to many types of data sources and then shape the data to meet our needs. Shaping data means transforming our data in a meaningful data that is easy to understand. The data transformation contains multiple steps for transforming the data into meaningful data and some of them are as follows:
- Renaming columns or Tables
- Removing Rows
- Removing Columns
- Data Type Transformation
- Replacing Values and Replacing Errors and so on.
All the steps used when performing a transformation are recorded by the Query and each time this query connects to the data source those steps are carried out so that the data is always shaped the way we specified earlier.
Combining data means connecting two or more data sources together and shaping them as needed and consolidating them into a single useful query.
Use the following procedure to shape and combine the data.
Step 1: Connecting to our first data source
Open Power BI Designer and select Web as a data source and click on Connect.
Paste the following web URL into the TextBox provided and click on OK.
States ranked from First to Worst on Retirement

The navigator window returns what it found on the web page. Here in our example, the navigator found a table ( Table 0 ) and the overall web document. Select the table and the navigator will display the preview of the table. Before loading the table we will edit the query by selecting Edit Query from bottom of the navigator window.
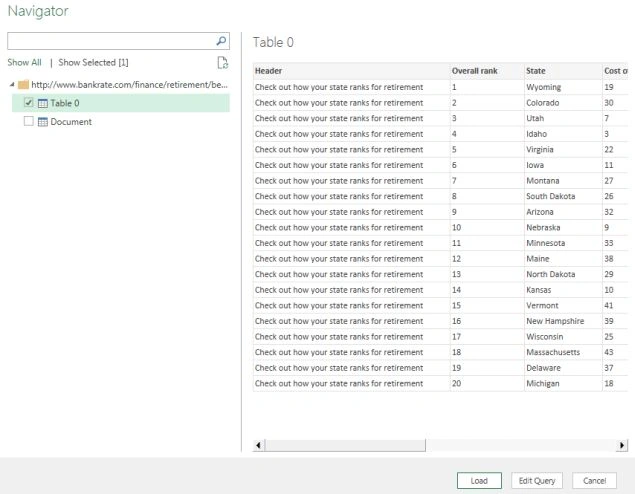
The table is now loaded into the query.
Step 2: Shaping the first data source
-
If we see the Health care quality column we will find some row contains the (tie) alphabets that will create a problem later. So let us remove this first.
Select the header of the Health Care Quality column and select the Replace Values option from the Transform ribbon tab and enter the text to be replaced with the new text.
-
Delete the Header column.
-
Rename the table name from Table 0 to RetirementStats.
-
Change the data type of all the columns except State from Text to Decimal Number by selecting all the columns and select Data Type -> Decimal Number from the Transform ribbon tab.
Step 3: Connecting to our second data source
Select the New Source option from the Home ribbon tab and again select Web as a new data source and paste the following URL.
List of US State Abbreviations

The query will start evaluating and we will see the Navigator window with the evaluation query result. Select the Table[edit] table from the list and click on the edit query.
The table is now loaded into the query.
Step 4: Shaping the second data source
-
Remove the top 3 rows by selecting the Remove Rows -> Remove Top Rows option from the Home ribbon tab.

-
Also, remove 26 bottom rows by selecting the Remove Rows -> Remove Bottom Rows option from the Home ribbon tab.
-
Remove all the other columns except the Region Name and Codes ANSI by selecting both the column and select Remove Columns -> Remove Other Columns from the Home ribbon tab.
-
Rename the Region Name column to State Name and Codes ANSI column to State Code.
-
Rename this table from Table[edit] to StatesCodeInfo.
Now that we have shaped both the tables the way we want, let us now combine both two tables into one table.
Step 5: Merging Queries
Select the Merge Queries option from the Home ribbon tab.
The Merge window appears that prompts us to select the table we want to merge. To merge two queries/tables we should have some matching columns in both tables.
Now select the State Name header and from the drop down list select the RetirementStats table and from the RetirementStats table select the State header column.
Note: We will receive a warning below as "The selection has matched 50 out of the first 51 rows" and tick on the Only include matching rows checkbox. We have one extra row ( District of Columbia ) in our StatesCodeInfo table. That's why it is giving us a warning: The selection has matched 50 out of the first 51 rows.
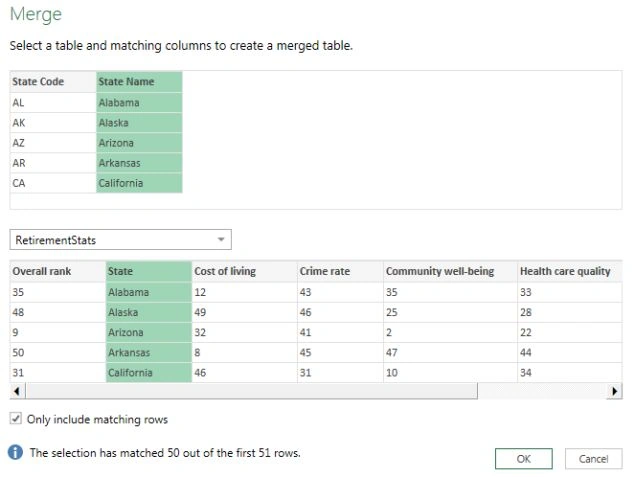
A NewColumn will be created at the end of the query as shown below.
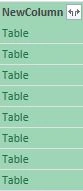
Now if we click on any of the rows from the NewColumn list we will find all the information about that state at a single place including State Name, State Code, Health Care Quality Crime Rate, Overall Rank, Cost of Living, Tax Rate and Community well-being.

As of now we have enough data to create a few of the interesting reports. Let's build some of them.
Step 6 : Build Reports
To create a new visualization report, just drag and drop the fields (table columns) from the Fields list onto the Report view.
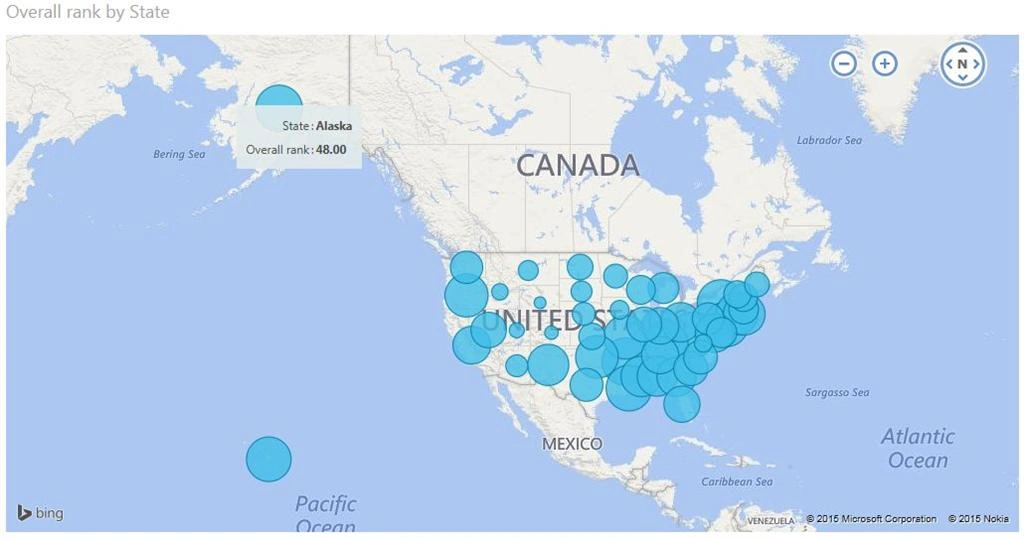
States based on Overall Rank
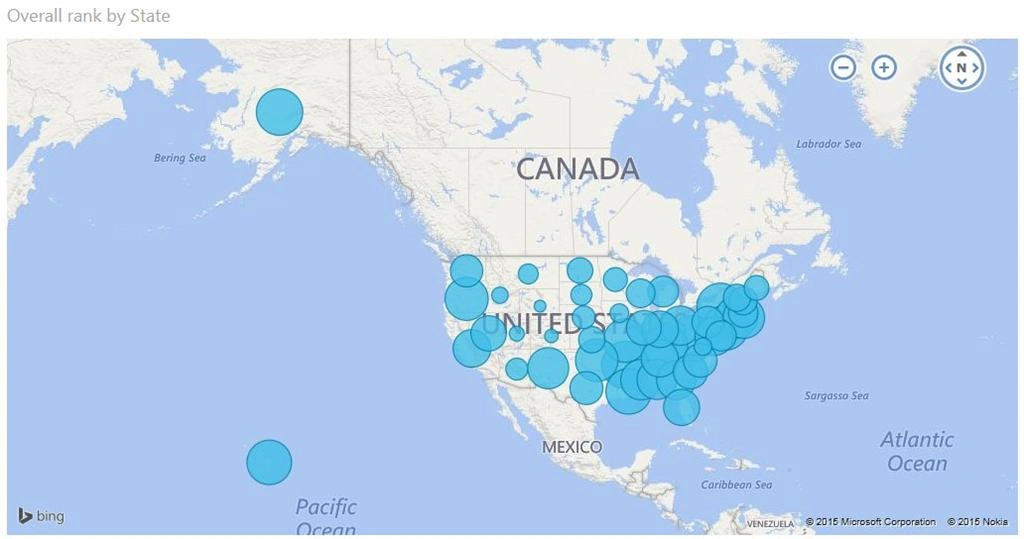
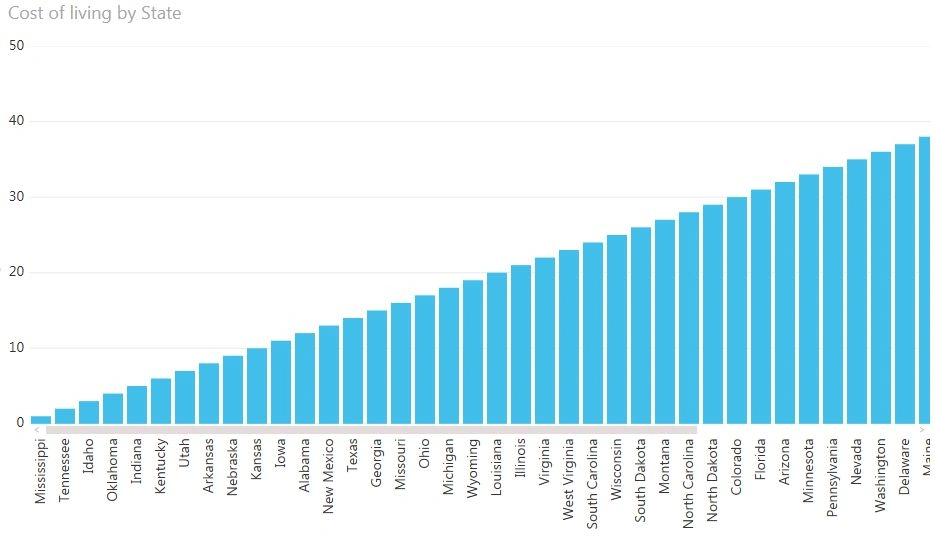
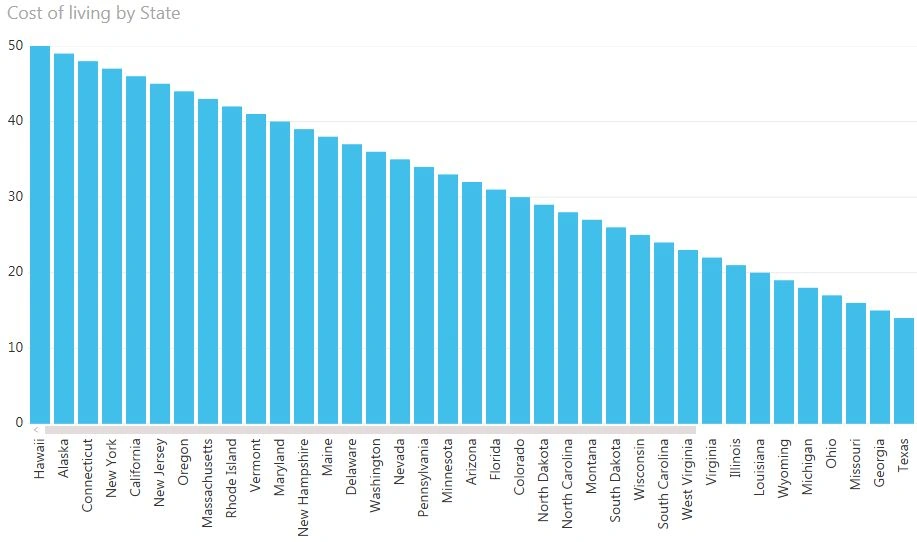
Best and Worst 10 States based on Cost of Living
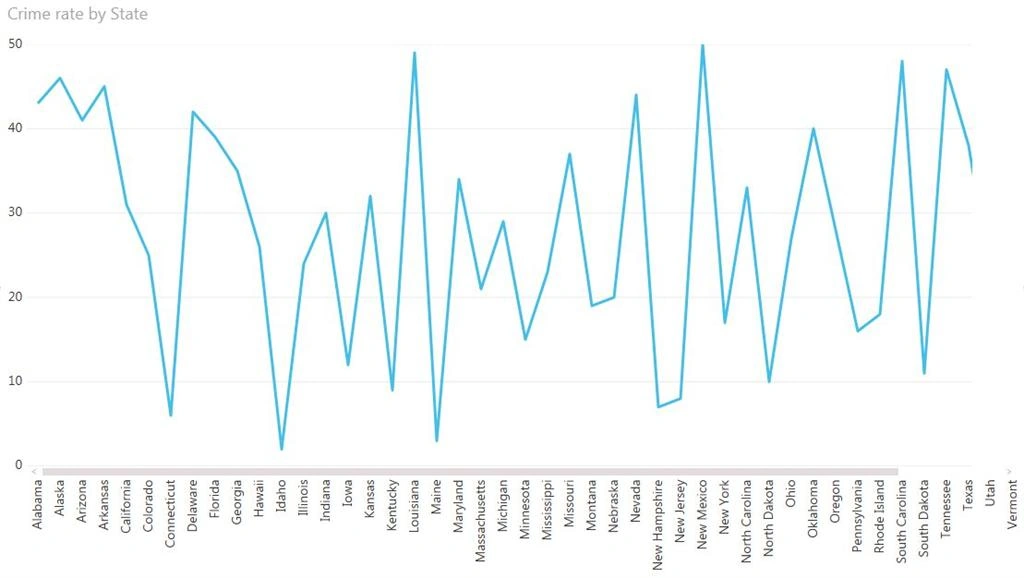
States based on Crime Rate
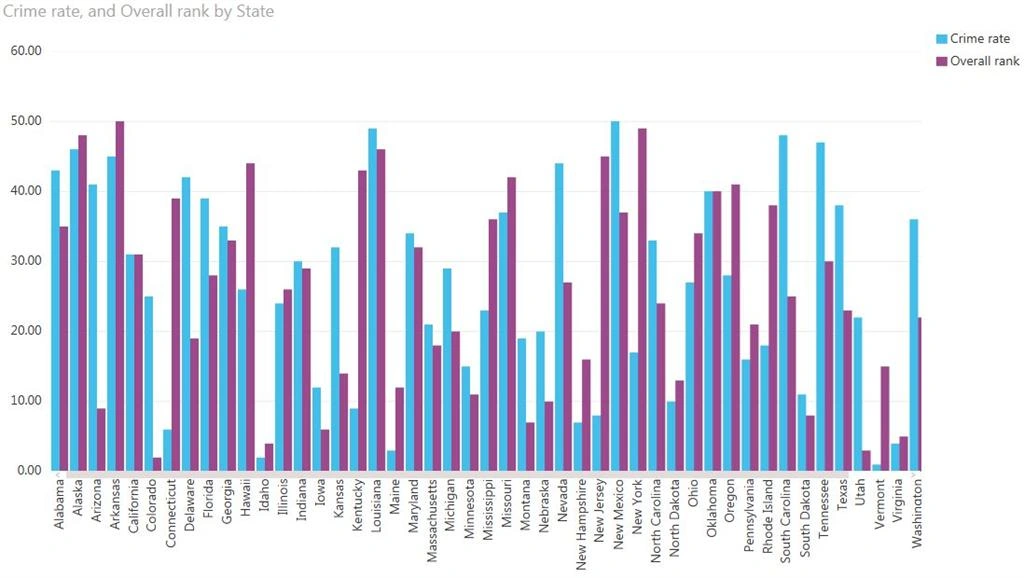
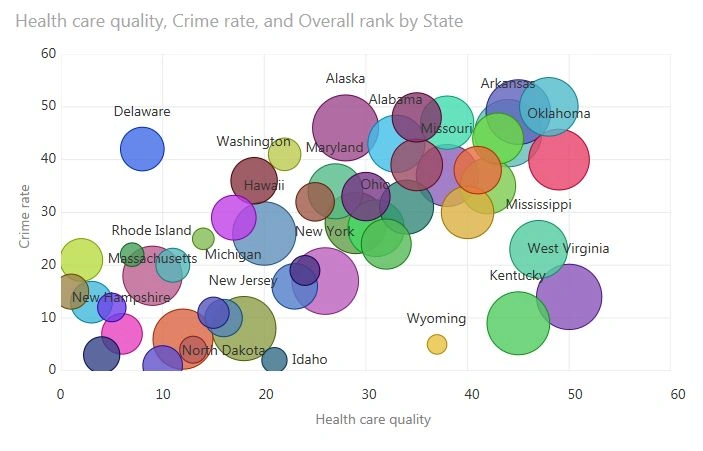
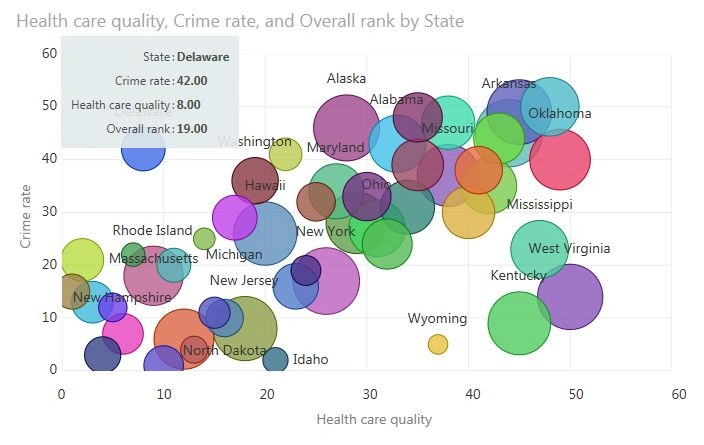
Health, Crime Rate, Overall Rank by State
Summary
In this article we learned how to shape and combine multiple data queries into a single data query using the Power BI Designer.
NitinPosted Apr 2, 2015, 11:45 AM
nice
Karthik Muthu KaruppanPosted Apr 2, 2015, 11:08 AM
informative
Tom MohanPosted Apr 2, 2015, 2:41 AM
colorful
Yatendra SharmaPosted Apr 2, 2015, 12:08 AM
nyc article Abhishek Arora
Gowtham RajamanickamPosted Apr 1, 2015, 11:04 PM
good..