
Introduction
In this article, we tackle a common data visualization task; creating a sales dashboard. A sales dashboard is widely used in business presentations, to outline key performance indicators for a given business process or objective. Key to any such presentation is the good visualization of the data, as well as the polished appearance. To do this, I am using related chart components, that offer all of the required functionality. The sample uses ASP.NET chart from ShieldUI, that is freely available from their site.
The finished presentation looks like this: 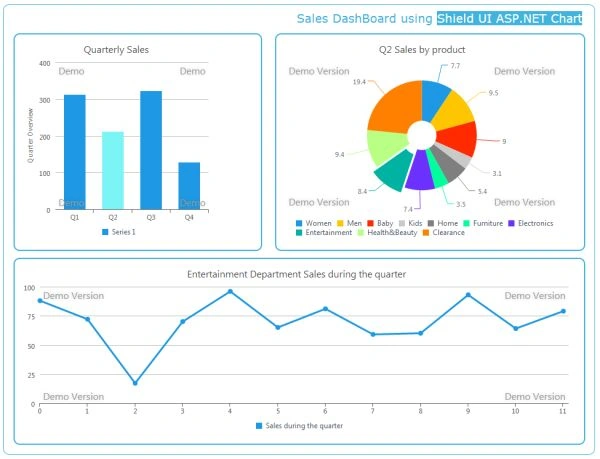
Using the code
To start off, I create a new Visual Studio project for the web. The web application needs to contain a single .aspx file, that will host the related controls. The second step is to include the DLL files for the chart components to the project: 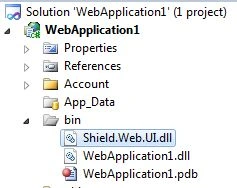
Once we have added the DLLs for the component we will use, we need to reference it in the project.
This can be done directly in the .aspx page, containing our dashboard sample:
- <%@ Register Assembly="Shield.Web.UI" Namespace="Shield.Web.UI" TagPrefix="shield" %>
Then, since this control is a server-side wrapper of a client JavaScript component, we also need to include references to the base JavaScript chart. This is also done in the .aspx file:
- <head>
- <link rel="stylesheet" type="text/css" href="shield-chart.1.2.2-Trial/shield-chart.1.2.2-Trial/css/shield-chart.min.css" />
- <script src="shield-chart.1.2.2-Trial/shield-chart.1.2.2-Trial/js/jquery-1.9.1.min.js" type="text/javascript"></script>
- <script src="shield-chart.1.2.2-Trial/shield-chart.1.2.2-Trial/js/shield-chart.all.min.js" type="text/javascript"></script>
- </head>
- <asp:updatepanel id="UpdatePanel2" runat="server" updatemode="Conditional" childrenastriggers="false">
- <ContentTemplate>
- <shield:shieldchart id="ShieldChart1" runat="server" autopostback="true" onselectionchanged="ShieldChart1_SelectionChanged"
- width="320px" height="330px" ontakedatasource="ShieldChart1_TakeDataSource">
- <PrimaryHeader Text="Quarterly Sales">
- </PrimaryHeader>
- <ExportOptions AllowExportToImage="false" AllowPrint="false" />
- <TooltipSettings CustomPointText="Sales Volume: <b>{point.y}</b>">
- </TooltipSettings>
- <Axes>
- <shield:ChartAxisX CategoricalValuesField="Quarter">
- </shield:ChartAxisX>
- <shield:ChartAxisY>
- <Title Text="Quarter Overview"></Title>
- </shield:ChartAxisY>
- </Axes>
- <DataSeries>
- <shield:ChartBarSeries DataFieldY="Sales">
- <Settings EnablePointSelection="true" EnableAnimation="true">
- <DataPointText BorderWidth="">
- </DataPointText>
- </Settings>
- </shield:ChartBarSeries>
- </DataSeries>
- <Legend Align="Center" BorderWidth=""></Legend>
- </shield:shieldchart>
- </ContentTemplate>
- </asp:updatepanel>
It is wrapped in an update panel, to provide smooth visual updates.
In order to populate the chart control with data, we use the TakeDataSource event handler, in the code-behind of the .aspx file:
- protected void ShieldChart1_TakeDataSource(object sender, Shield.Web.UI.ChartTakeDataSourceEventArgs e)
- {
- ShieldChart1.DataSource = new object[]
- {
- new {Quarter = "Q1", Sales = 312 },
- new {Quarter = "Q2", Sales = 212 },
- new {Quarter = "Q3", Sales = 322 },
- new {Quarter = "Q4", Sales = 128 }
- };
- }
- <div id="container2" style="width: 490px; height: 340px; margin: auto; top: 5px;
- left: 5px; position: inherit;">
- <asp:updatepanel id="UpdatePanel1" runat="server" updatemode="Conditional" childrenastriggers="false">
- <ContentTemplate>
- <shield:shieldchart id="ShieldChart2" ontakedatasource="ShieldChart2_TakeDataSource"
- autopostback="true" onselectionchanged="ShieldChart2_SelectionChanged" runat="server"
- width="463px" height="331px">
- <ExportOptions AllowExportToImage="false" AllowPrint="false" />
- <PrimaryHeader Text="Select a Quarter to show products sales">
- </PrimaryHeader>
- <Axes>
- <shield:ChartAxisY>
- <Title Text="Break-Down for selected quarter"></Title>
- </shield:ChartAxisY>
- </Axes>
- <DataSeries>
- <shield:ChartDonutSeries EnableValueXSorting="false" CollectionAlias="Q Data" DataFieldY="Data" DataFieldX="Product">
- <Settings EnablePointSelection="true" EnableAnimation="true" AddToLegend="true">
- <DataPointText BorderWidth="">
- </DataPointText>
- </Settings>
- </shield:ChartDonutSeries>
- </DataSeries>
- <Legend Align="Center" BorderWidth=""></Legend>
- </shield:shieldchart>
- </ContentTemplate>
- <Triggers>
- <asp:AsyncPostBackTrigger ControlID="ShieldChart1" EventName="SelectionChanged" />
- </Triggers>
- </asp:updatepanel>
- </div>
- <div id="container3_box" style="width: 925px; height: 300px; border: 2px solid #40B3DF;
- margin: auto; top: 420px; left: 25px; position: absolute;">
- <div id="container3" style="width: 890px; height: 290px; margin: auto; top: 5px;
- left: 5px; position: inherit;">
- <asp:updatepanel id="UpdatePanel3" runat="server" updatemode="Conditional">
- <ContentTemplate>
- <shield:ShieldChart ID="ShieldChart3" runat="server" OnTakeDataSource="ShieldChart3_TakeDataSource"
- Width="905px" Height="280px">
- <DataSeries>
- <shield:ChartLineSeries DataFieldY="QuarterSales">
- <Settings AddToLegend="false">
- <DataPointText BorderWidth="">
- </DataPointText>
- </Settings>
- </shield:ChartLineSeries>
- </DataSeries>
- <PrimaryHeader Text="Select a product to show sales details...">
- </PrimaryHeader>
- <ExportOptions AllowExportToImage="false" AllowPrint="false" />
- <Legend Align="Center" BorderWidth=""></Legend>
- </shield:ShieldChart>
- </ContentTemplate>
- <Triggers>
- <asp:AsyncPostBackTrigger ControlID="ShieldChart2" EventName="SelectionChanged" />
- </Triggers>
- </asp:updatepanel>
- </div>
- </div>
- protected void ShieldChart1_SelectionChanged(object sender, ChartSelectionChangedEventArgs e)
- {
- if (e.Selected)
- {
- SelectedQuarter = e.Name;
- DataPerformance = GetPerformanceData().Where(d => d.Quarter == SelectedQuarter).ToList();
- }
- else
- {
- DataPerformance = null;
- }
- ShieldChart2.DataBind();
- }
- protected void ShieldChart2_SelectionChanged(object sender, ChartSelectionChangedEventArgs e)
- {
- if (e.Selected)
- {
- SalesData = GetSalesDataProducts().Where(s => s.Quarter == SelectedQuarter && s.Product == e.Item.ValueX.ToString()).ToList();
- }
- else
- {
- SalesData = null;
- }
- ShieldChart3.DataBind();
- }
This completes our setup, and the sales dashboard is ready for use. Feel free to download the code sample on the top of the article and explore the code for further reference.
Wang WenPosted May 10, 2015, 10:11 PM
Great! I've tried VanCharts in many projects and works pretty well. You can try it.
Sanjeeb LenkaPosted Aug 29, 2013, 5:10 AM
looks good . let me try this....