

Abstract
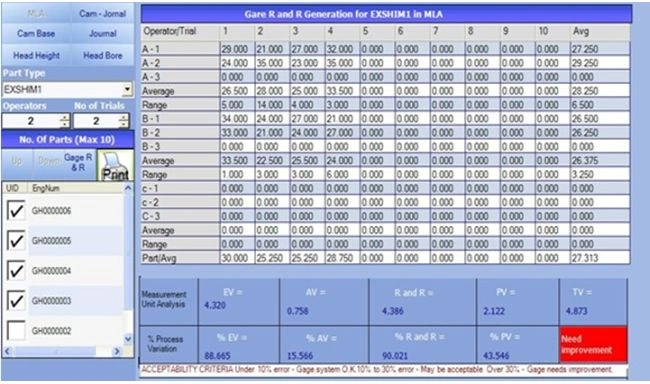
Nowadays the automobile industries are interested in automated measuring machines to ensure quality and to compete in the global industry. The Gauge Repeatability and Reproducibility takes a major role to ensure quality by measuring the automobile components. The purpose is to make repeatability and reproducibility of the Measuring Systems like Camshaft, Crankshaft, and so on. A digital sensor is used for measuring the Camshaft and Crankshaft. Then the measured data has been analyzed using Gauge Repeatability and Reproducibility methodology. Gage R&R is a Statistical method for analyzing the measurement data. The result of this system can make the standard system competitive with the global industry.
Introduction
I have been worked on several Automation projects. In my project I get a chance to work on Gage R&R. Instead of using third-party tools, I planned to create a simple program using C# for Gage R&R. I finally completed the program and it is running in an automation company. The main purpose of this article is to share what I study for developing a Gage R&R to all other members. When I search in C# Corner for Gage R&R, am unable to find anything related to Gage R&R. So I am happy to write the first article about Gage R&R on this website.
In this article, I have attached a sample Gage R&R Study Excel worksheet for your reference.
It is a fact of nature that all data contains random variation. Part of this variation is due to individual differences, but another part of this variation is due to uncertainty in the measurements caused by variability in the measurement equipment and process. If the measurement uncertainty is too large then the measurement system may be unusable. A gage repeatability and reproducibility (R&R) study looks at this variability [1] .
Gage R&R helps determine the magnitude of the variation in a measurement system as well as the sources of this variation. While the sources of variation can be numerous, three of these sources are fundamental: part-to-part variation, repeatability and reproducibility [1].
Part-to-part variation is the normal range over which measurements are made; the part of your data you actually want to measure. Repeatability is the variation because of the gage itself, while reproducibility is the variation because of various operators using the gage. Repeatability and reproducibility together are called "measurement error," or simply "noise," and are measured as "gage R&R." This noise is a nuisance that adds uncertainty to your data. A good measurement system has very low noise, preferably less than 1% of the total variability in your data, indicated as a gage R&R of less than 10%. A questionable system will have noise between 1% and 9% of the total variability, or a gage R&R between 10% and 30%. A poor system will have noise greater than 9% of the total variation, or a gage R&R greater than 30% [1].
Gage R&R measures the size of the noise relative to the total data variation, that is called % of total variation or %TV, and relative to the specification range, called % of tolerance. It also separates the variability into its sources, namely part-to-part variation, repeatability and reproducibility. This information helps operators determine how to fix a poor measurement system. For instance, a high repeatability relative to reproducibility indicates the need for a better gage. A high reproducibility relative to repeatability indicates the need for better operator training in the use of the gage [1].
Gage Repeatability
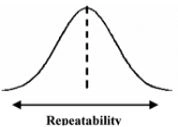
The variation obtained from one gage and one operator when measuring the same part several times. Understanding measurement System [2].
Gage Reproducibility
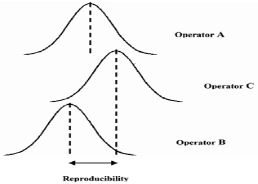
The difference in the average of the measurements made by various operators using the same gage when measuring the same part. Understanding measurement System [2].
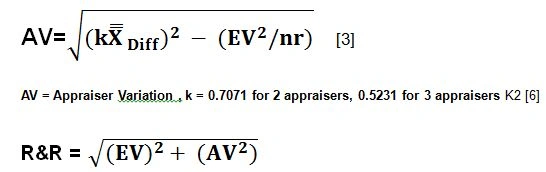
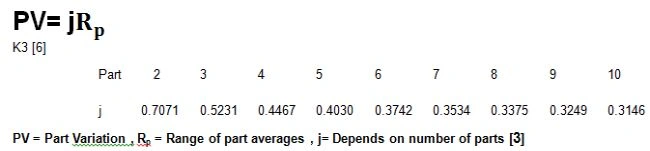
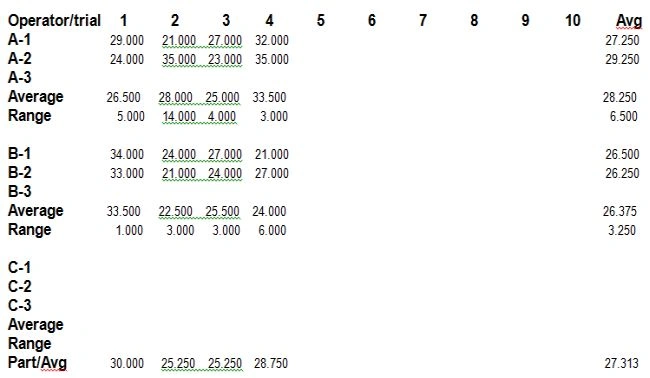
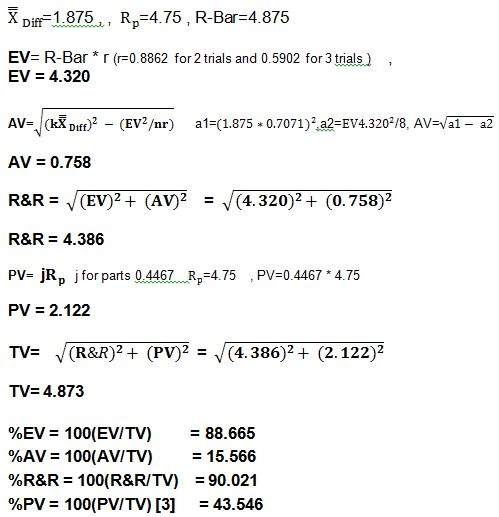
There are various ways by which the R&R of an instrument may be assessed, one of which is outlined below. This method, that is based on the method recommended by the Automotive Industry Action Group (AIAG), first computes for variations due to the measuring equipment and its operators. The over-all GR&R is then computed from these component variations.


Join the conversation! Your thoughts help the community grow.