

I am using the same concept to create a web method in a web service and calling those methods in jQuery.
Step 1
Create a table as in the following:
- CREATE TABLE tblRevenue (
- Id int Primary Key IDENTITY(1,1) NOT NULL,
- amount bigint NULL,
- quarter varchar(4) NULL,
- year varchar(4) NULL,
- )
After completion of table design, enter some of the test data into table to work for our sample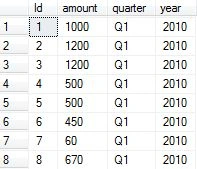
We will now create a web method in the web service and use that method to call it from jQuery.
Step 2
Create an ASP.NET Web Service. Add an .asmx page to the current solution and modify the code as in the following example:
- using System;
- using System.Collections.Generic;
- using System.Linq;
- using System.Web;
- using System.Web.Services;
- using System.Data;//
- using System.Data.SqlClient;//
- namespace DrillDownHighchart.Services
- {
- /// <summary>
- /// Summary description for WebServiceChart
- /// </summary>
- [WebService(Namespace = "http://tempuri.org/")]
- [WebServiceBinding(ConformsTo = WsiProfiles.BasicProfile1_1)]
- [System.ComponentModel.ToolboxItem(false)]
- // To allow this Web Service to be called from script, using ASP.NET AJAX, uncomment the following line.
- [System.Web.Script.Services.ScriptService]
- public class WebServiceChart : System.Web.Services.WebService
- {
- public class RevenueEntity
- {
- public string year { get; set; }
- public int amount { get; set; }
- public Boolean drilldown { get; set; }
- }
- [WebMethod]
- public List<RevenueEntity> GetRevenueByYear()
- {
- List<RevenueEntity> YearRevenues = new List<RevenueEntity>();
- DataSet ds = new DataSet();
- using (SqlConnection con = new SqlConnection("Data Source=.;Trusted_Connection=true;DataBase=test"))
- {
- using (SqlCommand cmd = new SqlCommand())
- {
- cmd.CommandText = "select year,SUM(amount)amount from tblRevenue group by year";
- cmd.Connection = con;
- using (SqlDataAdapter da = new SqlDataAdapter(cmd))
- {
- da.Fill(ds, "dsRevenue");
- }
- }
- }
- if (ds != null)
- {
- if (ds.Tables.Count > 0)
- {
- if (ds.Tables["dsRevenue"].Rows.Count > 0)
- {
- foreach (DataRow dr in ds.Tables["dsRevenue"].Rows)
- {
- YearRevenues.Add(new RevenueEntity
- {
- year = dr["year"].ToString(),
- amount = Convert.ToInt32(dr["amount"]),
- drilldown = true
- });
- }
- }
- }
- }
- return YearRevenues;
- }
- [WebMethod]
- public List<RevenueEntity> GetRevenueByQuarter(string year)
- {
- List<RevenueEntity> QuarterRevenues = new List<RevenueEntity>();
- DataSet ds = new DataSet();
- using (SqlConnection con = new SqlConnection("Data Source=.;Trusted_Connection=true;DataBase=test"))
- {
- using (SqlCommand cmd = new SqlCommand())
- {
- cmd.CommandText = "select quarter,SUM(amount)amount from tblRevenue where year='" + year + "' group by quarter";
- cmd.Connection = con;
- using (SqlDataAdapter da = new SqlDataAdapter(cmd))
- {
- da.Fill(ds, "dsQuarter");
- }
- }
- }
- if (ds != null)
- {
- if (ds.Tables.Count > 0)
- {
- if (ds.Tables["dsQuarter"].Rows.Count > 0)
- {
- foreach (DataRow dr in ds.Tables["dsQuarter"].Rows)
- {
- QuarterRevenues.Add(new RevenueEntity
- {
- year = dr["quarter"].ToString(),
- amount = Convert.ToInt32(dr["amount"])
- });
- }
- }
- }
- }
- return QuarterRevenues;
- }
- }
- }
Don't forget to enable the attribute as in the following:
[System.Web.Script.Services.ScriptService]
Step 3
Add jQuery references as in the following:
- <script src="Script/jquery.min.js" type="text/javascript"></script>
- <script src="Script/highcharts.js" type="text/javascript"></script>
- <script src="Script/drilldown.js" type="text/javascript"></script>
Step 4
Implement jQuery Ajax as in the following:
- <script type="text/javascript">
- $(document).ready(function () {
- $.ajax({
- type: "POST",
- contentType: "application/json; charset=utf-8",
- url: "Services/WebServiceChart.asmx/GetRevenueByYear",
- data: "{}",
- dataType: "json",
- success: function (Result) {
- Result = Result.d;
- var data = [];
- for (var i in Result) {
- var serie = { name: Result[i].year, y: Result[i].amount, drilldown: Result[i].drilldown };
- data.push(serie);
- }
- BindChart(data);
- },
- error: function (Result) {
- alert("Error");
- }
- });
- });
- function BindChart(seriesArr) {
- $('#container').highcharts({
- chart: {
- type: 'column',
- backgroundColor: '#CCE6FF',
- borderColor: '#6495ED',
- borderWidth: 2,
- className: 'dark-container',
- plotBackgroundColor: '#F0FFF0',
- plotBorderColor: '#6495ED',
- plotBorderWidth: 1,
- events: {
- drilldown: function (e) {
- if (!e.seriesOptions) {
- var chart = this;
- chart.showLoading('Loading Quarter wise Revenue ...');
- var dataArr = CallChild(e.point.name);
- chart.setTitle({
- text: 'Quarter wise Revenue Report'
- });
- data = {
- name: e.point.name,
- data: dataArr
- }
- setTimeout(function () {
- chart.hideLoading();
- chart.addSeriesAsDrilldown(e.point, data);
- }, 1000);
- }
- }
- }
- },
- title: {
- text: 'Year wise Revenue Report'
- },
- xAxis: {
- type: 'category'
- },
- plotOptions: {
- series: {
- borderWidth: 0,
- dataLabels: {
- enabled: true
- }
- }
- },
- series: [{
- name: 'Year',
- colorByPoint: true,
- data: seriesArr
- }],
- drilldown: {
- series: []
- }
- });
- }
- function CallChild(name) {
- var Drilldowndata = [];
- $.ajax({
- type: "POST",
- contentType: "application/json; charset=utf-8",
- url: "Services/WebServiceChart.asmx/GetRevenueByQuarter",
- data: JSON.stringify({ year: name }),
- dataType: "json",
- success: function (Result) {
- Result = Result.d;
- for (var i in Result) {
- var serie = { name: Result[i].year, y: Result[i].amount };
- Drilldowndata.push(serie);
- }
- },
- error: function (Result) {
- alert("Error");
- }
- })
- return Drilldowndata;
- }
- t;/script>
Step 5
Do the UI Design as in the following:
- <body>
- <form id="form1" runat="server">
- <div id="container">
- </div>
- </form>
- </body>
Step 6
The output in a browser is as in the following: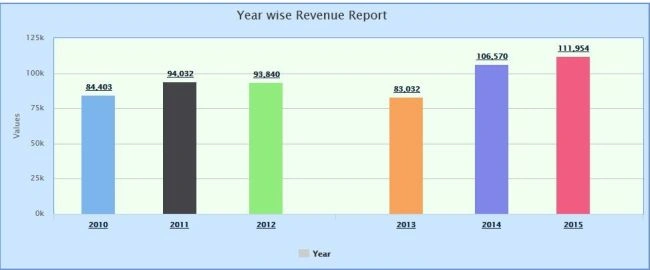
After clicking on bar the following chart by quarter will be generated.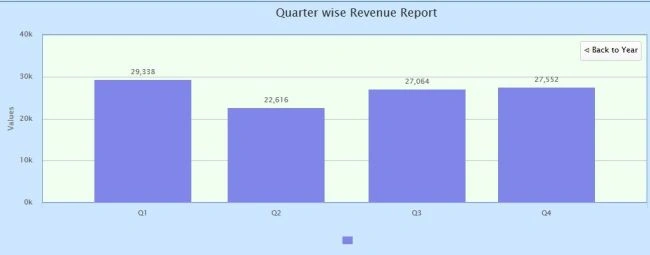
I hope you like this article and understood how to bind a drilldown highchart in ASP.NET using jQuery Ajax.
Thirupathi SPosted Apr 20, 2018, 7:20 AM
Please help me to generate the 3'rd level chart... i tried but can't please help me...its emergency need....
Ram kumarPosted Mar 15, 2018, 11:32 PM
Valuable share . Can you please share 3 or 4 level drill down
Parameswaran RPosted Aug 14, 2017, 9:29 AM
How to convert this code to MVC without web service???
sonu jnncePosted Mar 11, 2017, 6:23 AM
How to call drilldown upto 4th level please help me.
Diwesh TanwarPosted Apr 13, 2016, 9:57 AM
valuable share . Can you please share 3 or 4 level drill down
Niranjan PoddarPosted Dec 19, 2015, 3:03 AM
Nice Article..Thanks for sharing
Santhakumar MunuswamyPosted Aug 22, 2015, 7:46 AM
Good Article. Thanks for sharing
Yashwanth MuthineniPosted Aug 22, 2015, 7:25 AM
Nice share
Shridhar SharmaPosted Aug 20, 2015, 11:09 AM
Good one Amol.
RakeshPosted Aug 20, 2015, 10:28 AM
Good start
Rajeesh MenothPosted Aug 20, 2015, 7:44 AM
Good One
Upendra Pratap ShahiPosted Aug 20, 2015, 7:31 AM
nice info sir...
Vaikesh K PPosted Aug 20, 2015, 7:06 AM
Good One
Gopi ChandPosted Aug 20, 2015, 6:25 AM
Awesome dude..
Sibeesh VenuPosted Aug 20, 2015, 6:24 AM
Nice Share
Gowtham KPosted Aug 20, 2015, 5:40 AM
Nice
Karthikeyan KPosted Aug 20, 2015, 5:19 AM
Good one sir...Thanks for share