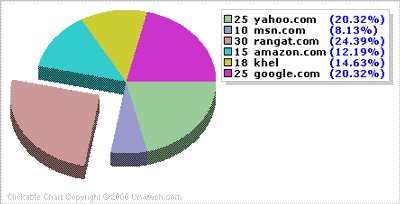
In my last article Creating a Pie Chart on Fly with VB.NET, I showed How to create dynamic pie chart using GdI+ capabilities, to extend that further I would like to show you code that would create exploded pie chart and implementing click through functionality to that chart.
Run sample code

Pie Chart component is made up of four classes and one enum.
- pieChartData (class)
- PieDrawData (class)
- pieChart (class)
- colordata (class)
- imageFormat (enum)
All of the above classes are under namespace UtChart.
pieChartData. As name suggests this class will keep all data required to define chart. Our first requirement to draw chart is array of chart values and legends if click through is required then array of links is required and if exploded chart is required then we will require array of bool type to determine to expload or not. Other then that we also have margins on top, bottom, left and right, piedia for specifying diameater of pie, array colorval for specifying colors of pie, imageformat to specify image formate( gif, jpeg, bmp), ExploadOffset which is Distance as Percentage of pieDia from center for Exploaded pie, chartFont is Font Used in Chart to Draw Legends, pieratio is Percentage of Pie Height to Pie Width and pie3dRatio is Percentage of Pie Thickness to Piedia.
As we also want to have click through facility we will require all calculation for drawing to be done separately, and then from that data we can draw chart and also create image map( For click through facility). Method getDrawdata does same thing once instance of pieChartData is created getDrawdata can provide data for drawing chart.
Another method getimageMap gives html image map using pieDrawdata object returned from getDrawData method.
PieDrawData. This class describes data which is required to draw chart and to get Image map. Object contains following properties, 'imageWidth' Chart's Image Width in pixels, 'imageHeight' Chart's Image Height in pixels, 'legendWidth' Maximum Width of Legend for Given Font, 'valWidth' Maximum Width of Chart Values for Given Font, 'PercentWidth' Maximum Width of Percentage for Given Font, 'pieRect' Array of Rectangle object for each correspoiding values, 'piewidth' Actual space taken by pie after adding values for exploaded pies, 'fontHeight' Height of font used for Writing on chart and 'LegandMap' Array of Rectangle object which describes actual position of legends on Image ( used for ImageMaping ).
pieChart. This class draws image by using graphics, it has only one method getPieChart which takes refrence of pieChartData and returns image as stream.
colordata. This class contains Array 31 colors, if there are more then 31 elements in charts then Piechartdatas constructor will take care to start again from first after 31st color. Also user can specify there own colors through colorval property of pieChartdata object.
imageFormat (enum). Contains three members.
- 'Gif' Corresponds to "System.Drawing.Imaging.ImageFormat.Gif" ,
- 'Jpeg' Corresponds to "System.Drawing.Imaging.ImageFormat.Jpeg" and
- 'Bmp' Corresponds to "System.Drawing.Imaging.ImageFormat.Bmp"
How to use this component:
First Compile files pieChart.cs, pieChartData.cs, pieDrawData.cs and chartCommon.cs under namespace Utchart.
Copy UtChart.dll to your bin directory of web server and copy PieCharServer.aspx and pieChartSample.aspx to you rootdirectory.
We will require two aspx files to present chart.
pieChartServer.aspx this page will generate Dynamic image using utChart assembly. This page will create pieChartData object first from query string data, and then pass reference of this object to method getPieChart of pieChart object to get stream which contains image. And finally save stream as Response.OutputStream.
pieChartSample.aspx this is a sample page which shows how to use piechart component, again in this page we will create pieChartData object from data passed through web form then we will use getImageMap method of pieChartData to get Image map. To display pie image on this page we will call pieChartServer.aspx
( <img src='pieChartServer.aspx?Legends=(yahoo.com, rangat.com, google.com)&Vals=(15,18,25)&Expload=(False,False,True)>)
Summary
Although I have shown only web page sample however you can also use same component for window application, once again I havent done error handling, other thing which comes in my mind is using images instead of colors in pie which you can try.